
The State of Personal Finance in America Q3 2026
 By
Introduction
Grocery prices. Headlines about the economy. Rising interest rates. For a lot of Americans right now, it feels like their financial future is being decided somewhere far away from their own kitchen table.
In fact, most Americans say the economy has more control over their financial future than they do. And yet, an even larger majority say they’re the ones ultimately responsible for their own financial success.
That tension shows up all over this quarter’s data. Health care and holiday costs are forcing tough trade-offs, and even some married couples who say they’re on the same page about money are keeping a few secrets from each other.
But Americans aren’t just sitting back and taking the hit. They’re looking for ways to survive tough times. Questioning whether college is the only road to success. Turning to AI for advice. People are taking action, and the numbers reflect both positive and negative effects.
This edition of The State of Personal Finance explores that ongoing tension: what Americans feel is out of their hands, what’s squeezing them hardest right now, and what’s still very much within their power to change.
Executive Summary
- 60% of Americans say the economy has more control over their financial future than they do.
- Close to 9 in 10 Americans (87%) say they are ultimately responsible for their own financial success.
- The share of U.S. adults who rate the economy as “unhealthy” or “very unhealthy” fell from 53% in Q2 to 46% in Q3, but two-thirds (66%) still say the economy is heading in a negative direction.
- 44% of Americans feel behind where they expected to be at this point in their lives.
- Half of Americans (52%) say their parents had it easier financially at their age, including 68% of both Gen Zers and millennials.
- An estimated 99 million U.S. adults (37%) have delayed or skipped receiving health care in the past three months because they couldn’t afford it.
- 8 in 10 married Americans say they and their spouse are on the same page with their money.
- Almost 3 in 4 Americans (72%) say learning a skilled trade is a better path to financial success than a college degree.
- Four in 10 Americans (43%) have used AI in the past three months to get advice—with the most popular topics being physical health (22%), money (16%), career (16%), mental health (14%), and relationships (10%).
- Half of Americans (53%) say they’re cutting back on Christmas gifts this year because of the cost.
Download a PDF version of this report.
Download a full electronic press kit (EPK)
of the report, including full-size graphics.
The Control Paradox: Who’s Really Behind the Wheel?
Every financial plan starts with a basic question: Who’s in charge here? For a lot of Americans, they don’t feel like the answer is “me.” Between rising prices, shifting interest rates and a steady stream of economic news, it’s easy to feel like you’re riding in the back seat of your own financial life.
Six in 10 Americans (60%) say the economy has more control over their financial future than they do. And when asked what has the bigger impact on their day-to-day finances right now, 58% point to outside factors like the economy or government policies—not their own decisions and habits.
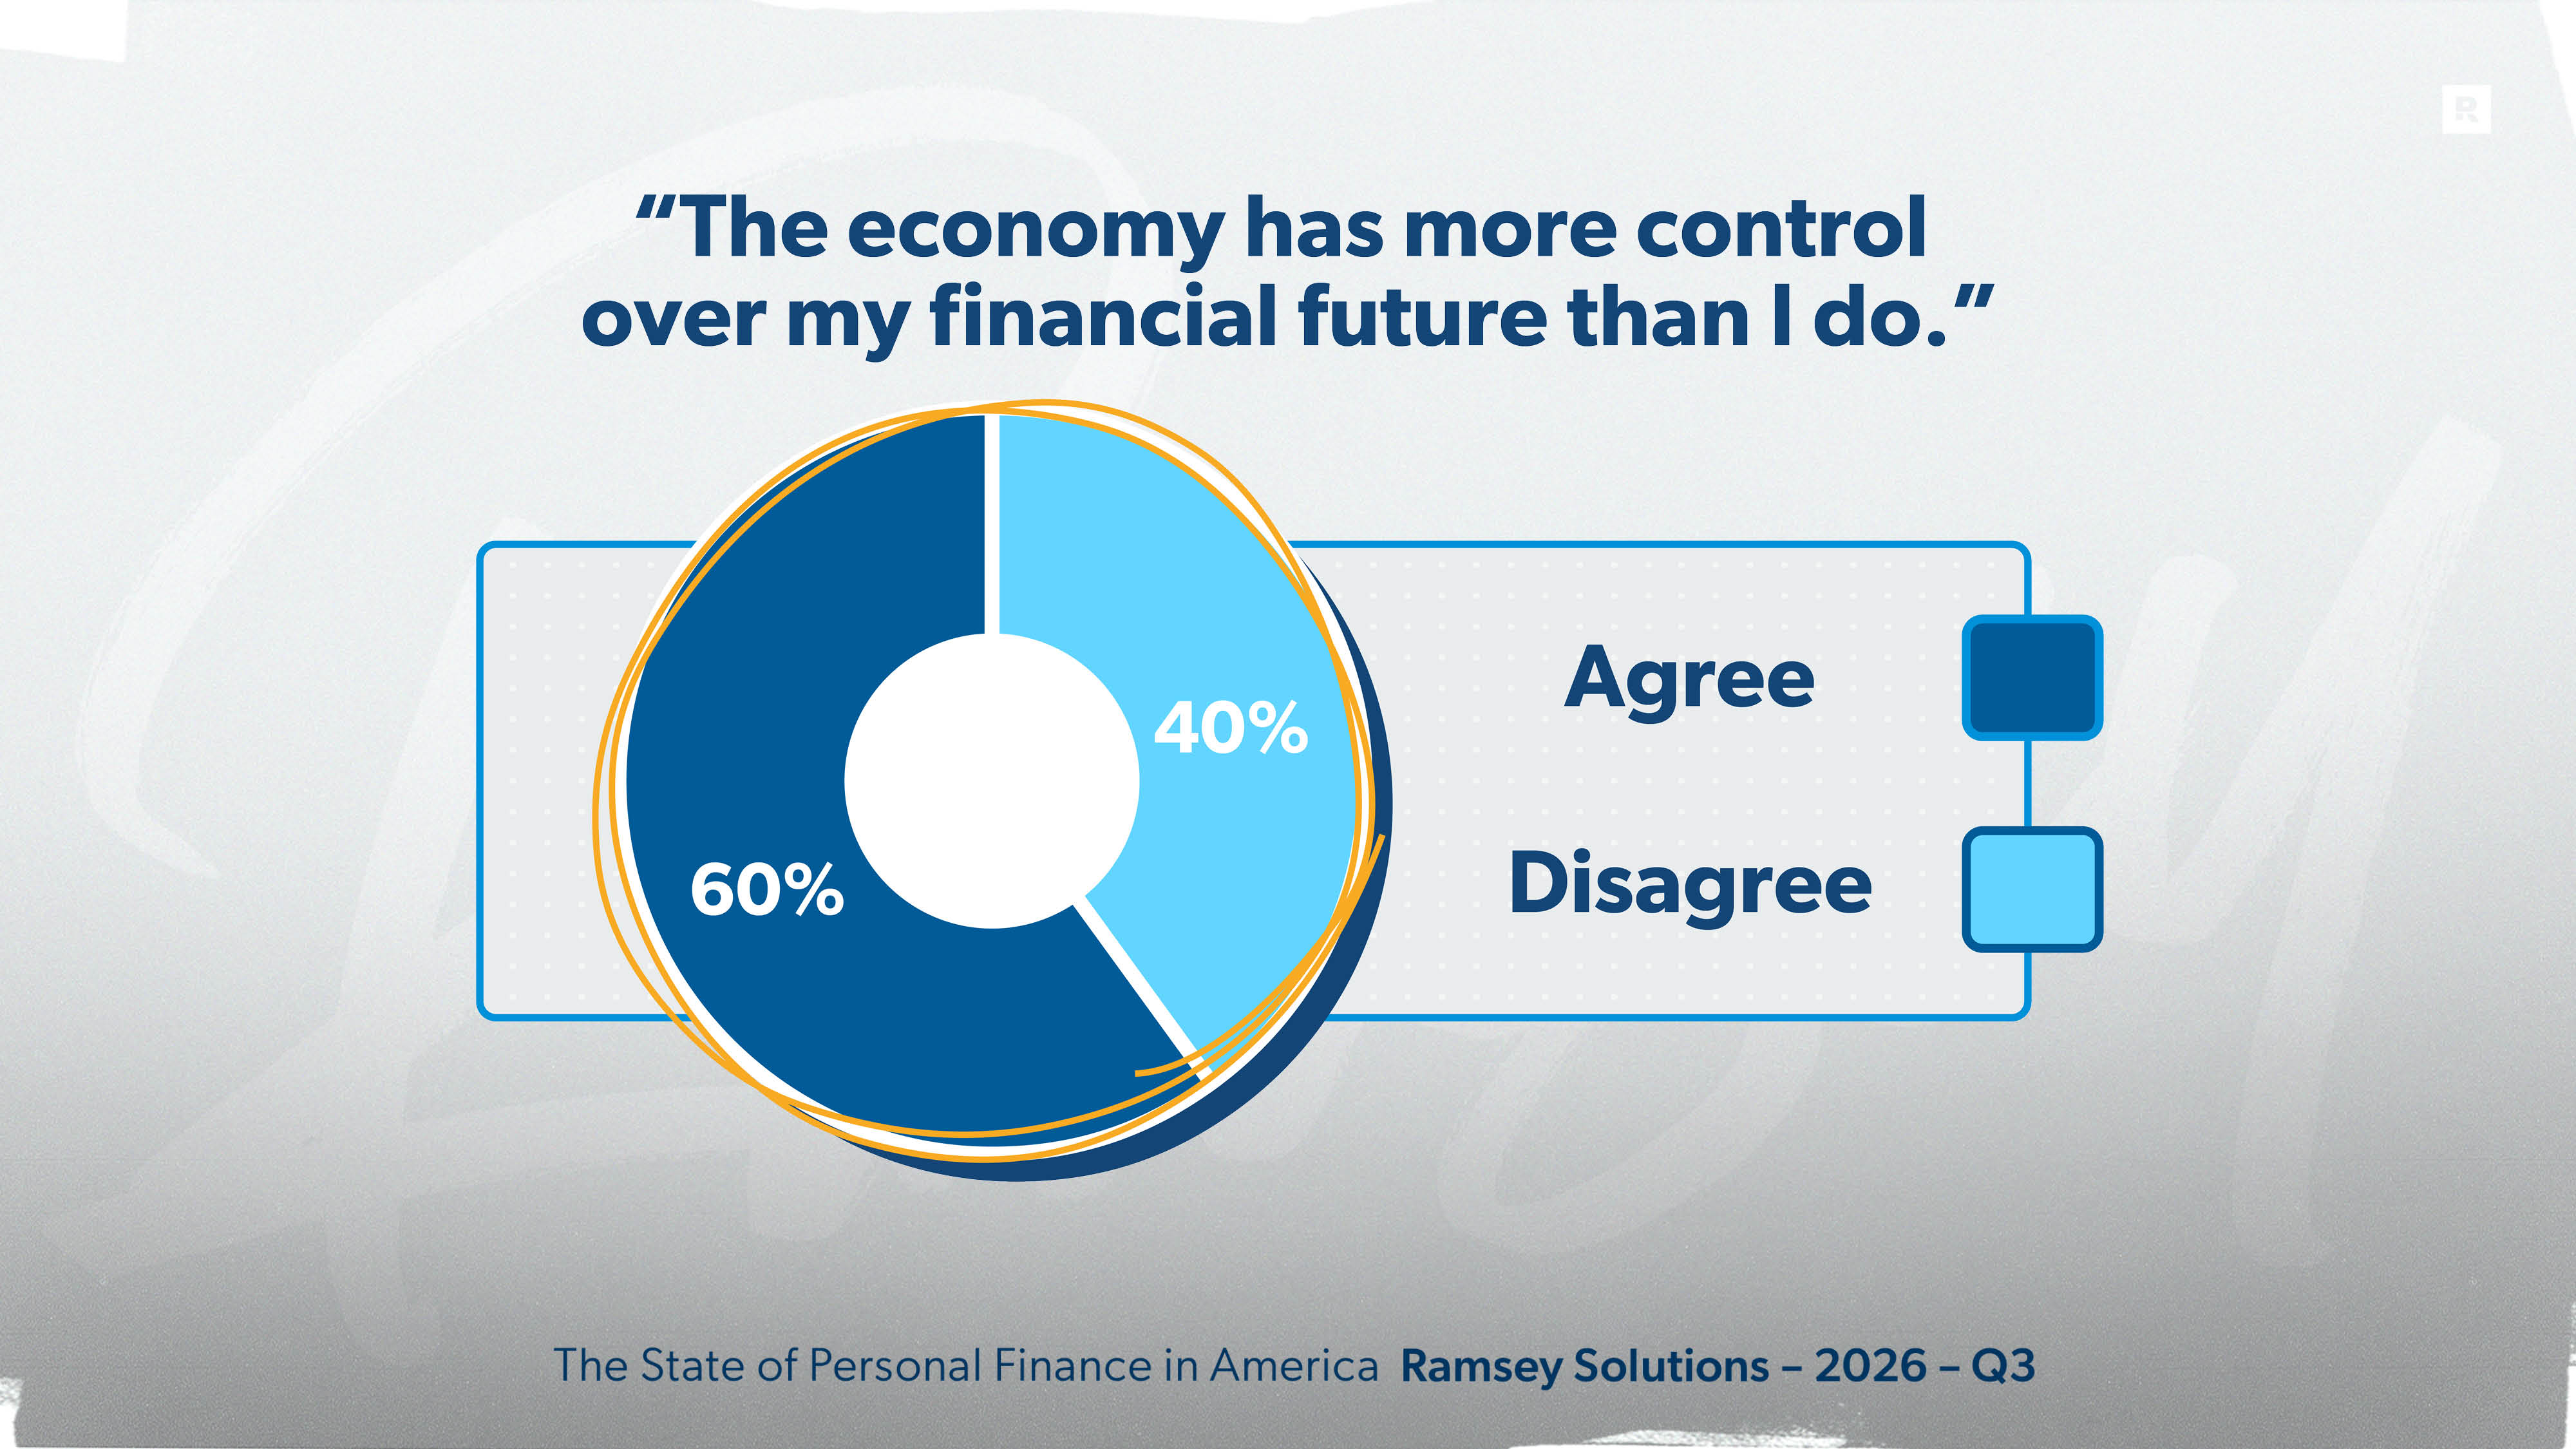
That feeling of powerlessness hits hardest among Americans with the least amount of financial margin. Seventy percent of Gen Zers say the economy is calling the shots, along with 69% of those earning under $50,000 a year and 66% of those carrying consumer debt. Compare that to baby boomers (47%) and debt-free Americans (48%), who are far less likely to feel like the economy is in the driver’s seat.
Baby boomers are most likely to say outside factors have the biggest impact on their day-to-day finances (73%). That may be because many of them live on fixed incomes, where rising prices eat into a budget that can’t easily stretch to cover them.
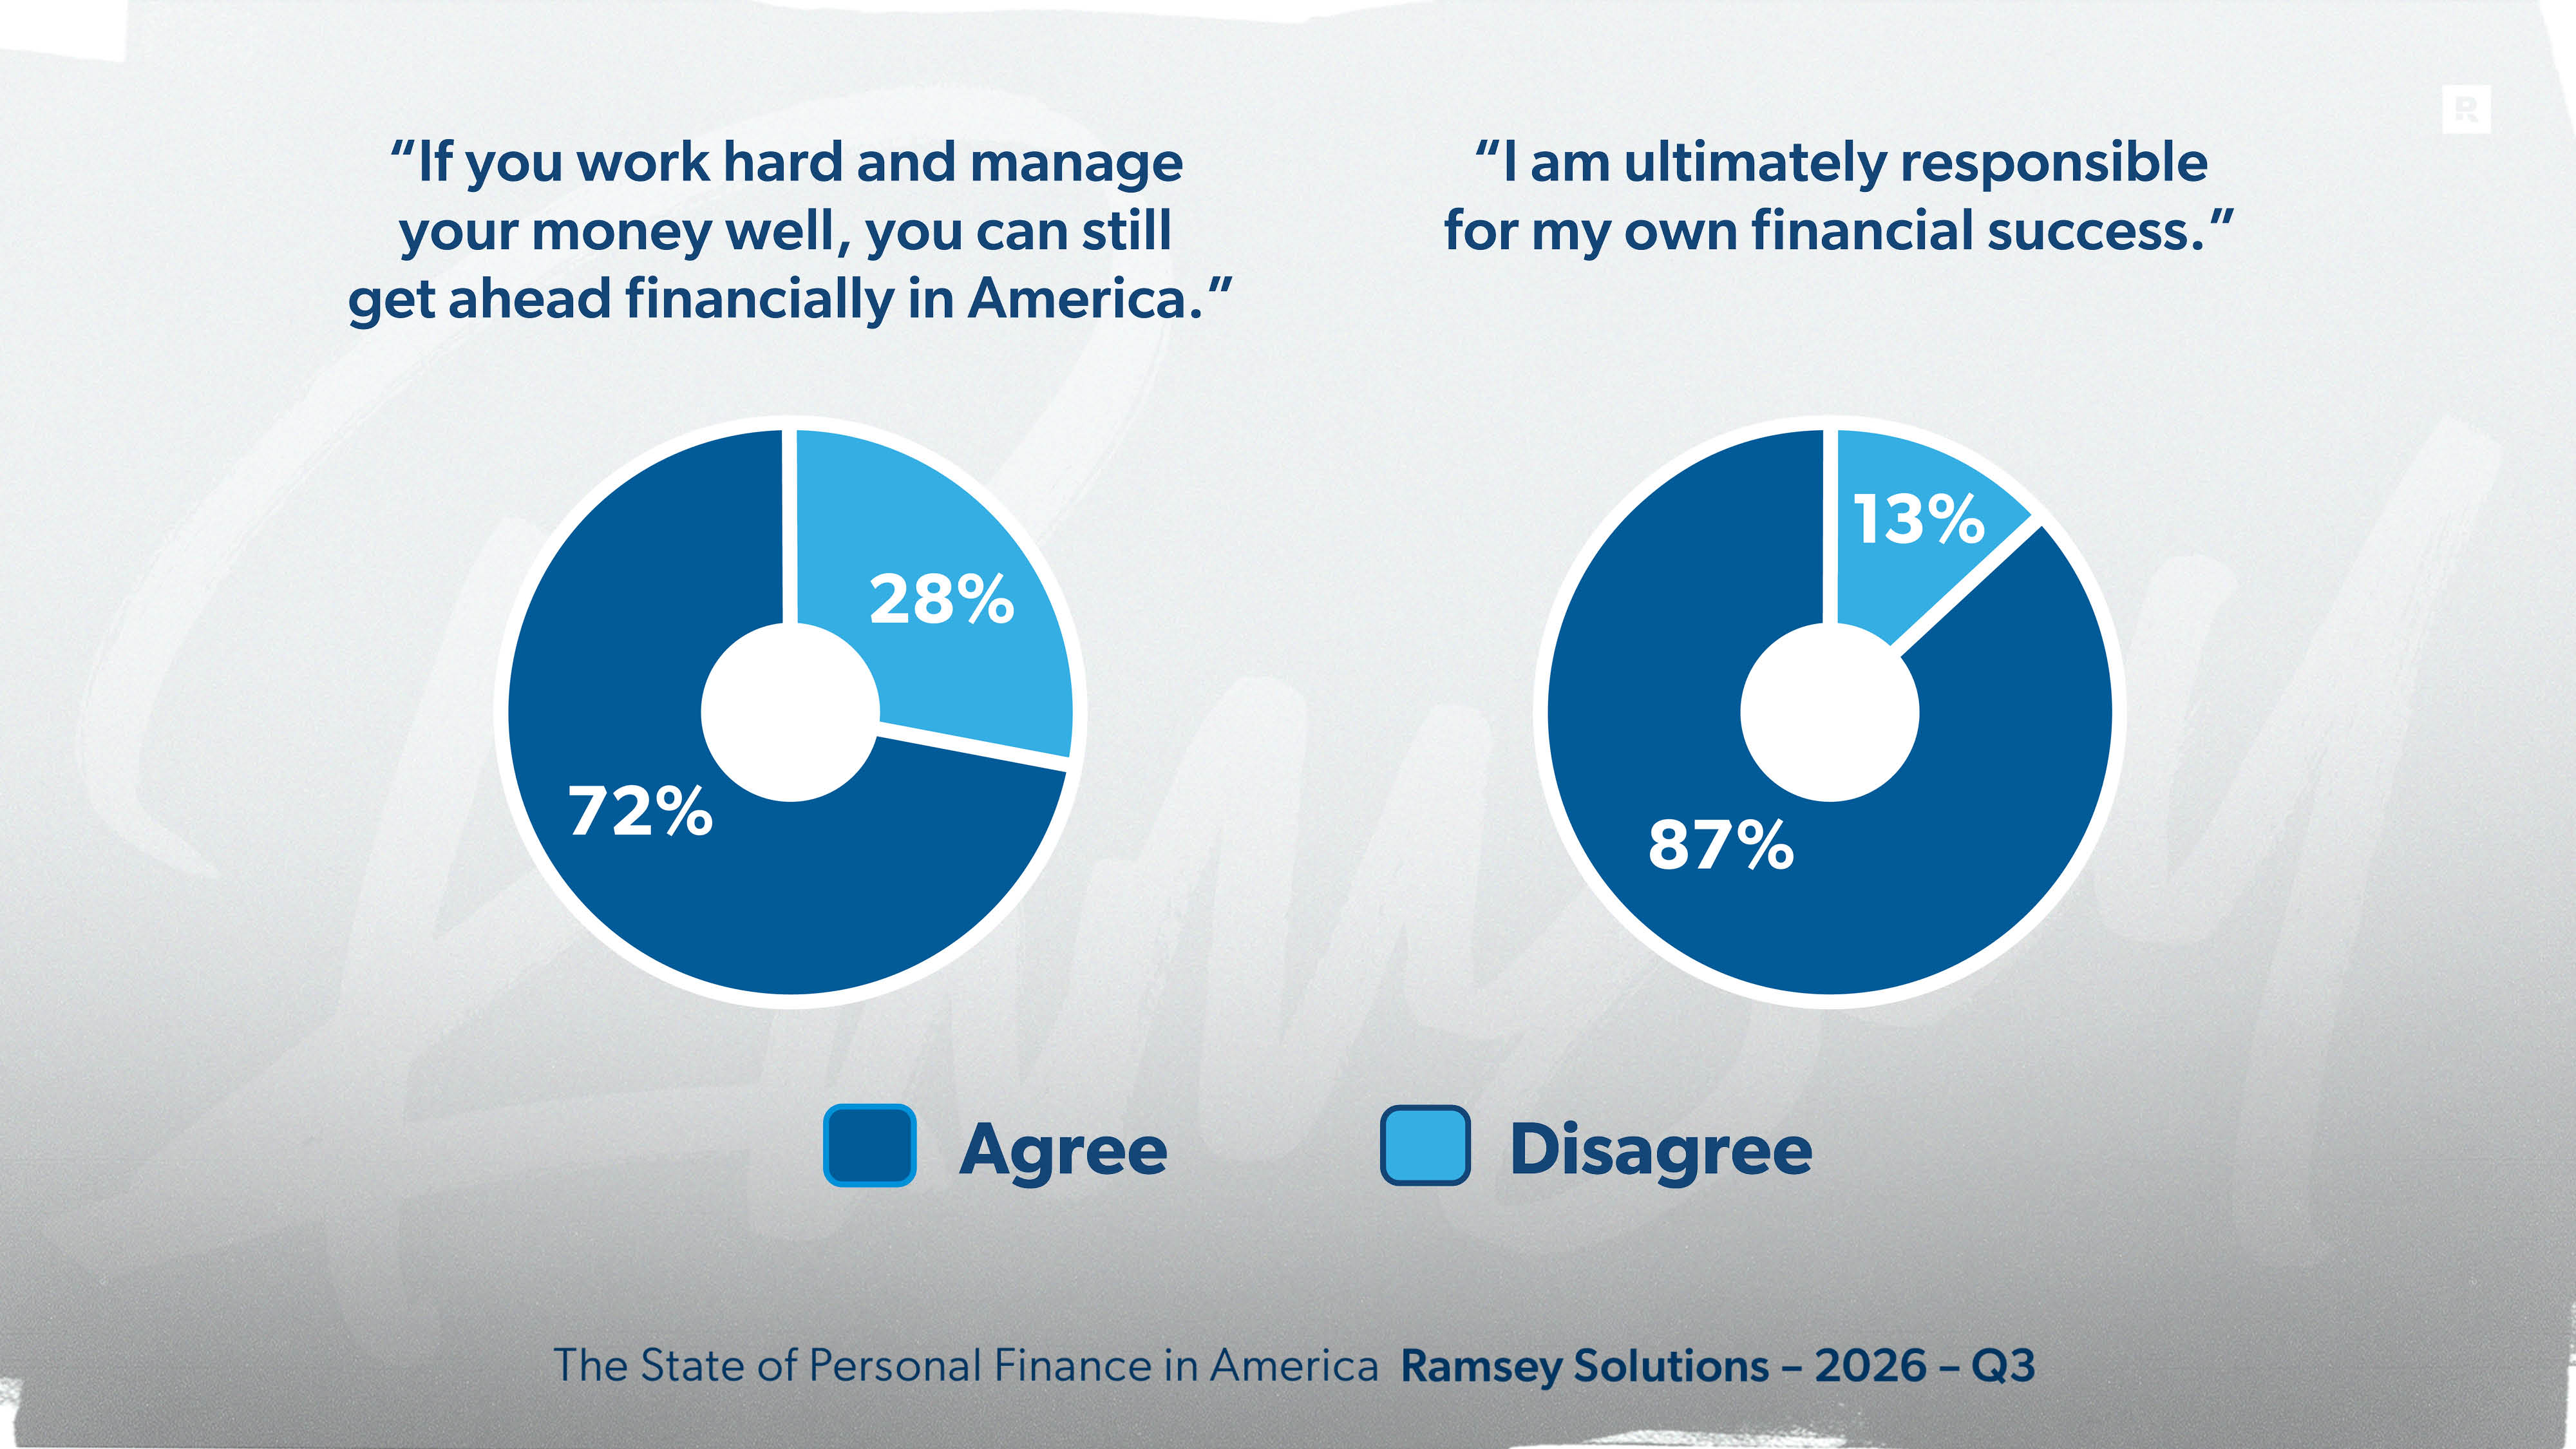
Despite feeling like they’re not in control, most Americans also think they are ultimately responsible for the direction their life takes. Almost three-quarters (72%) still believe that if you work hard and manage your money well, you can
get ahead financially in America. That belief is strongest among men (77%), baby boomers (82%), conservatives (83%) and debt-free Americans (81%).
And close to 9 in 10 Americans (87%) say they are ultimately responsible for their own financial success. That number climbs to 94% among baby boomers and 93% among households earning more than $100,000 a year.
Americans are feeling like outside forces have more sway over their financial future while simultaneously believing that their future is ultimately up to them. We’re calling this tension the control paradox—because Americans feel like they’re in control while also feeling like outside forces have more control.
The Bigger Picture: How Americans View the Economy
If many Americans believe the economy is steering their financial future, it’s worth asking how they think the economy is doing. Every quarter, we take the pulse on how Americans see the U.S. economy: its current health and where it’s headed. And it seems like Americans are feeling a little less gloomy than they were three months ago but not much more hopeful.
The share of U.S. adults who rate the economy as “unhealthy” or “very unhealthy” fell from 53% in Q2 to 46% in Q3.
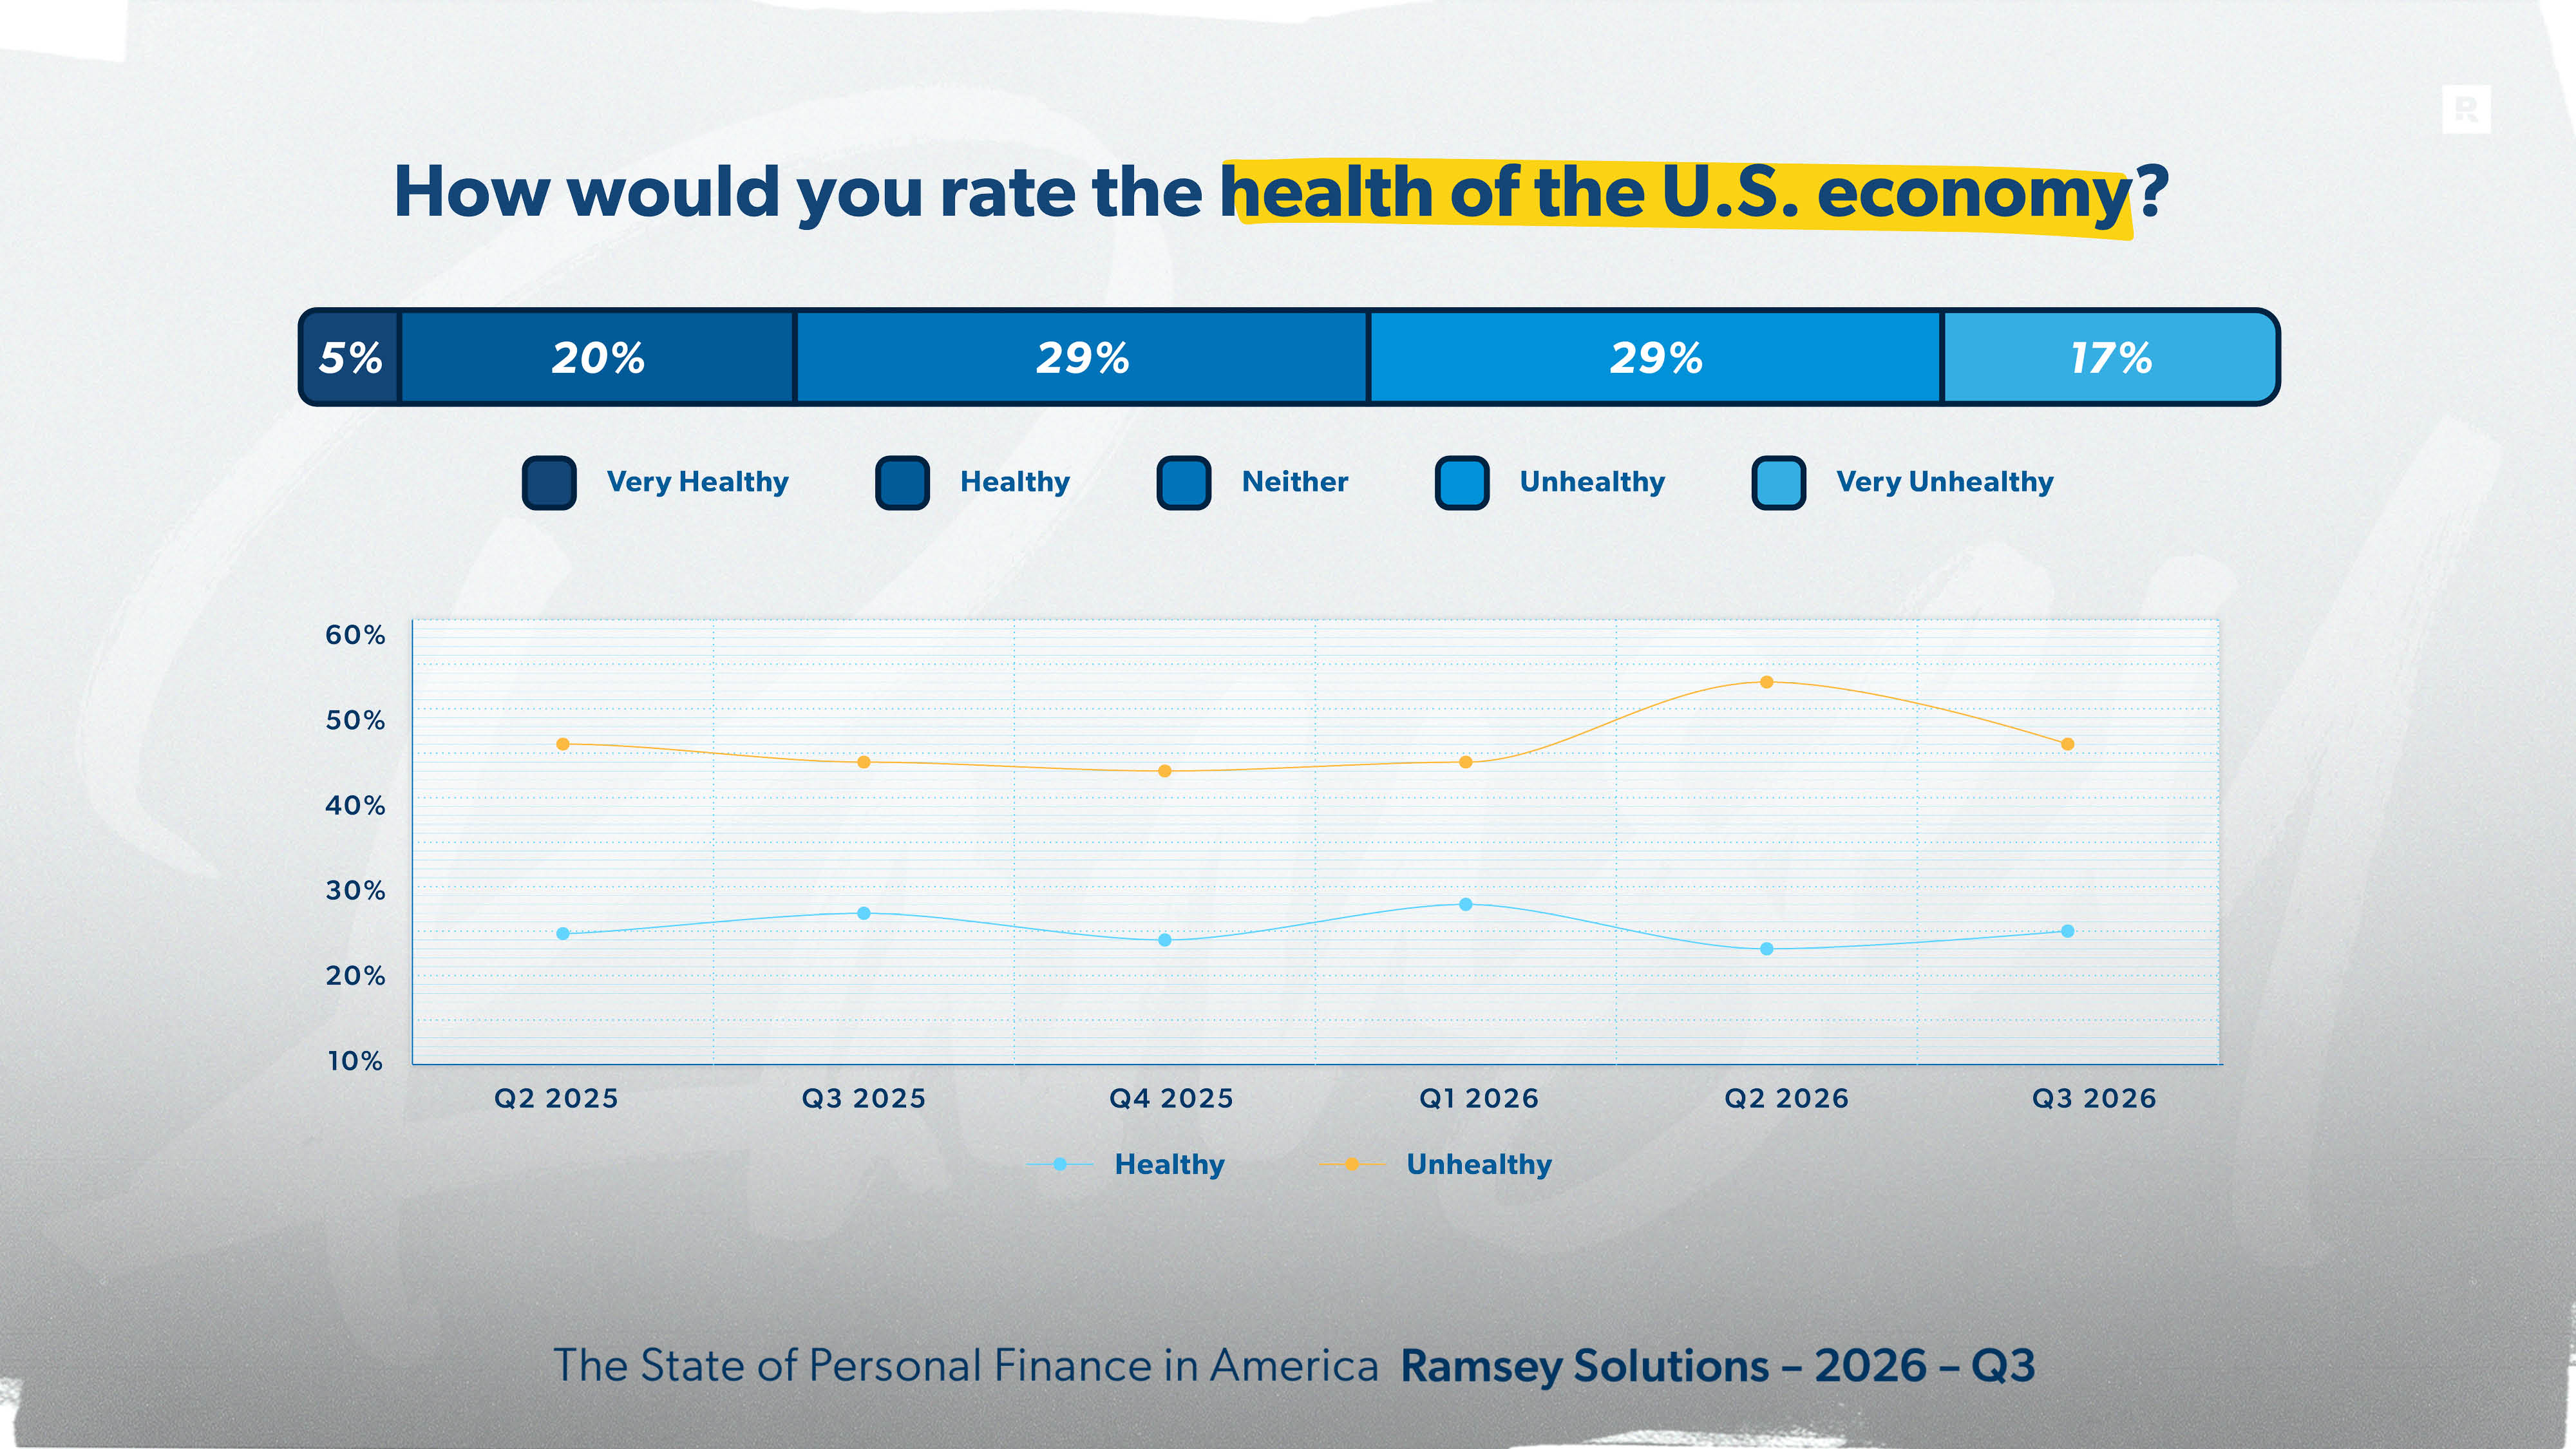
But fewer people feeling bad about the economy doesn’t mean more people feel good about it. The share who say the economy is “healthy” or “very healthy” barely moved, from 23% to 25%. Women (51%), Gen Xers (53%) and households earning under $100,000 are the most likely to call the economy unhealthy. Political leanings play a big role too: 63% of liberals say the economy is unhealthy, compared to 30% of conservatives.
Looking ahead, two-thirds of Americans (66%) still say the economy is heading in a negative direction, essentially unchanged from 68% last quarter. The political divide is even wider on this question, with 84% of liberals and 72% of moderates saying the economy is headed the wrong way, compared to 42% of conservatives.
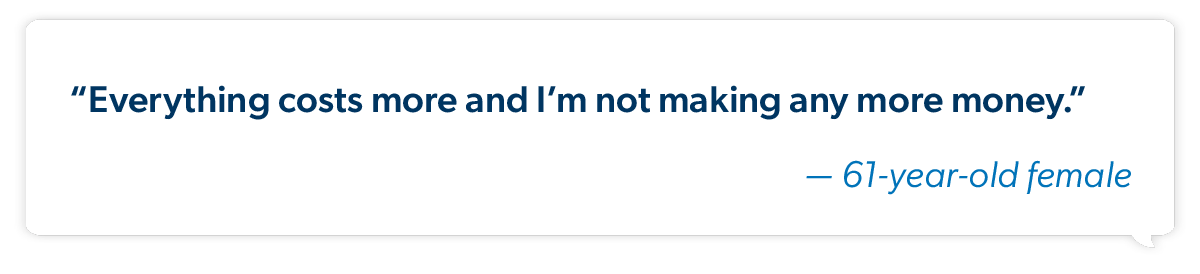
Politics also colors how Americans see what’s coming next. Belief that the economy will improve under the Trump administration held steady at 41%, up slightly from 38% last quarter but down from 52% when Trump took office in the first quarter of 2025. Two-thirds of conservatives (66%) believe the economy will improve, compared to 35% of moderates and 20% of liberals.
Feeling Behind: Measuring Up to Peers, Parents and Expectations
The economy is one measuring stick for financial success. But most people carry around another one: a mental timeline for their own lives. By a certain age, you figured you’d own a home, have some money in the bank, maybe be on track for retirement. When real life doesn’t line up with that timeline, it’s hard not to feel like you’ve fallen behind.
For a big chunk of Americans, that’s exactly how they feel right now. Forty-four percent of Americans feel behind where they expected to be at this point in their lives. Only 16% say they’re ahead of where they thought they’d be, and 40% feel right on track.
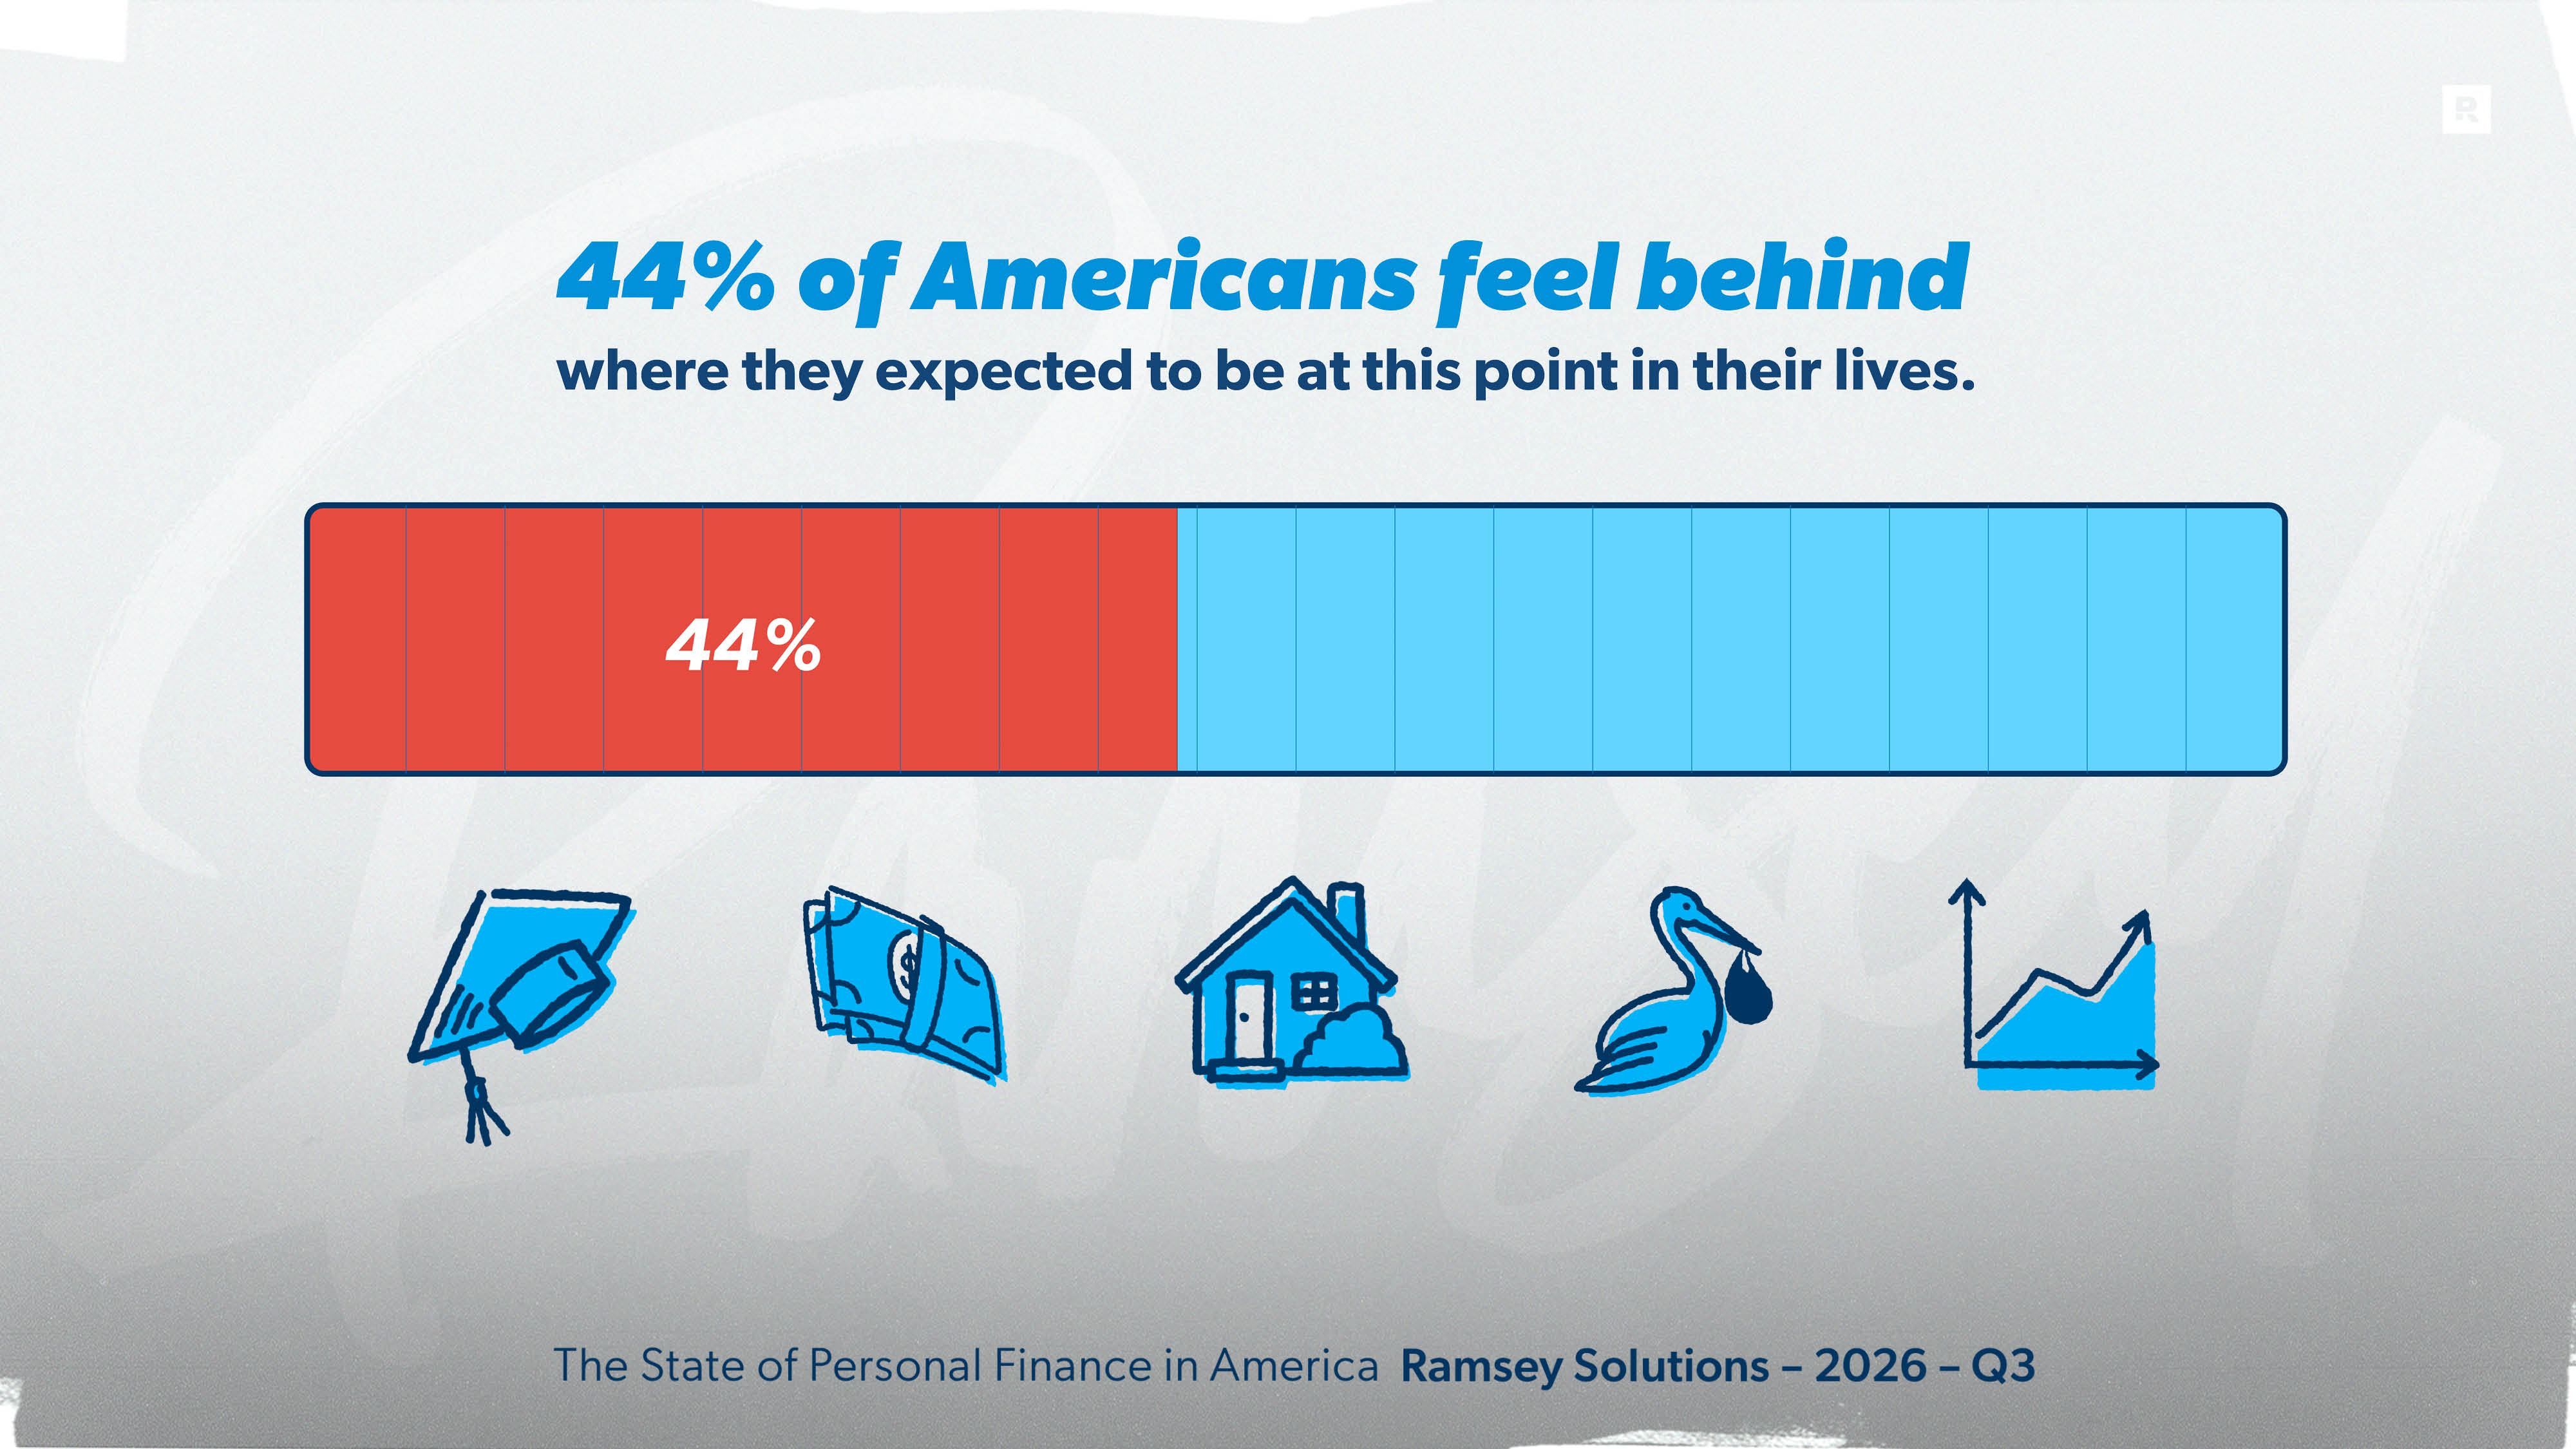
Gen X feels the most behind (53%). Many Gen Xers are in the thick of it right now—raising kids, helping aging parents, and watching retirement get closer every year. Millennials aren’t far behind at 50%.
Income and debt make a big difference as well. Sixty-one percent of Americans earning under $50,000 feel behind, compared to 27% of those earning over $100,000. And those with consumer debt are nearly twice as likely to feel behind as those who are debt-free (54% vs. 28%).
Of course, “behind” is usually measured against somebody else. About 1 in 3 Americans feel behind when they compare themselves to their parents at the same age (37%) or to other people their age (36%).
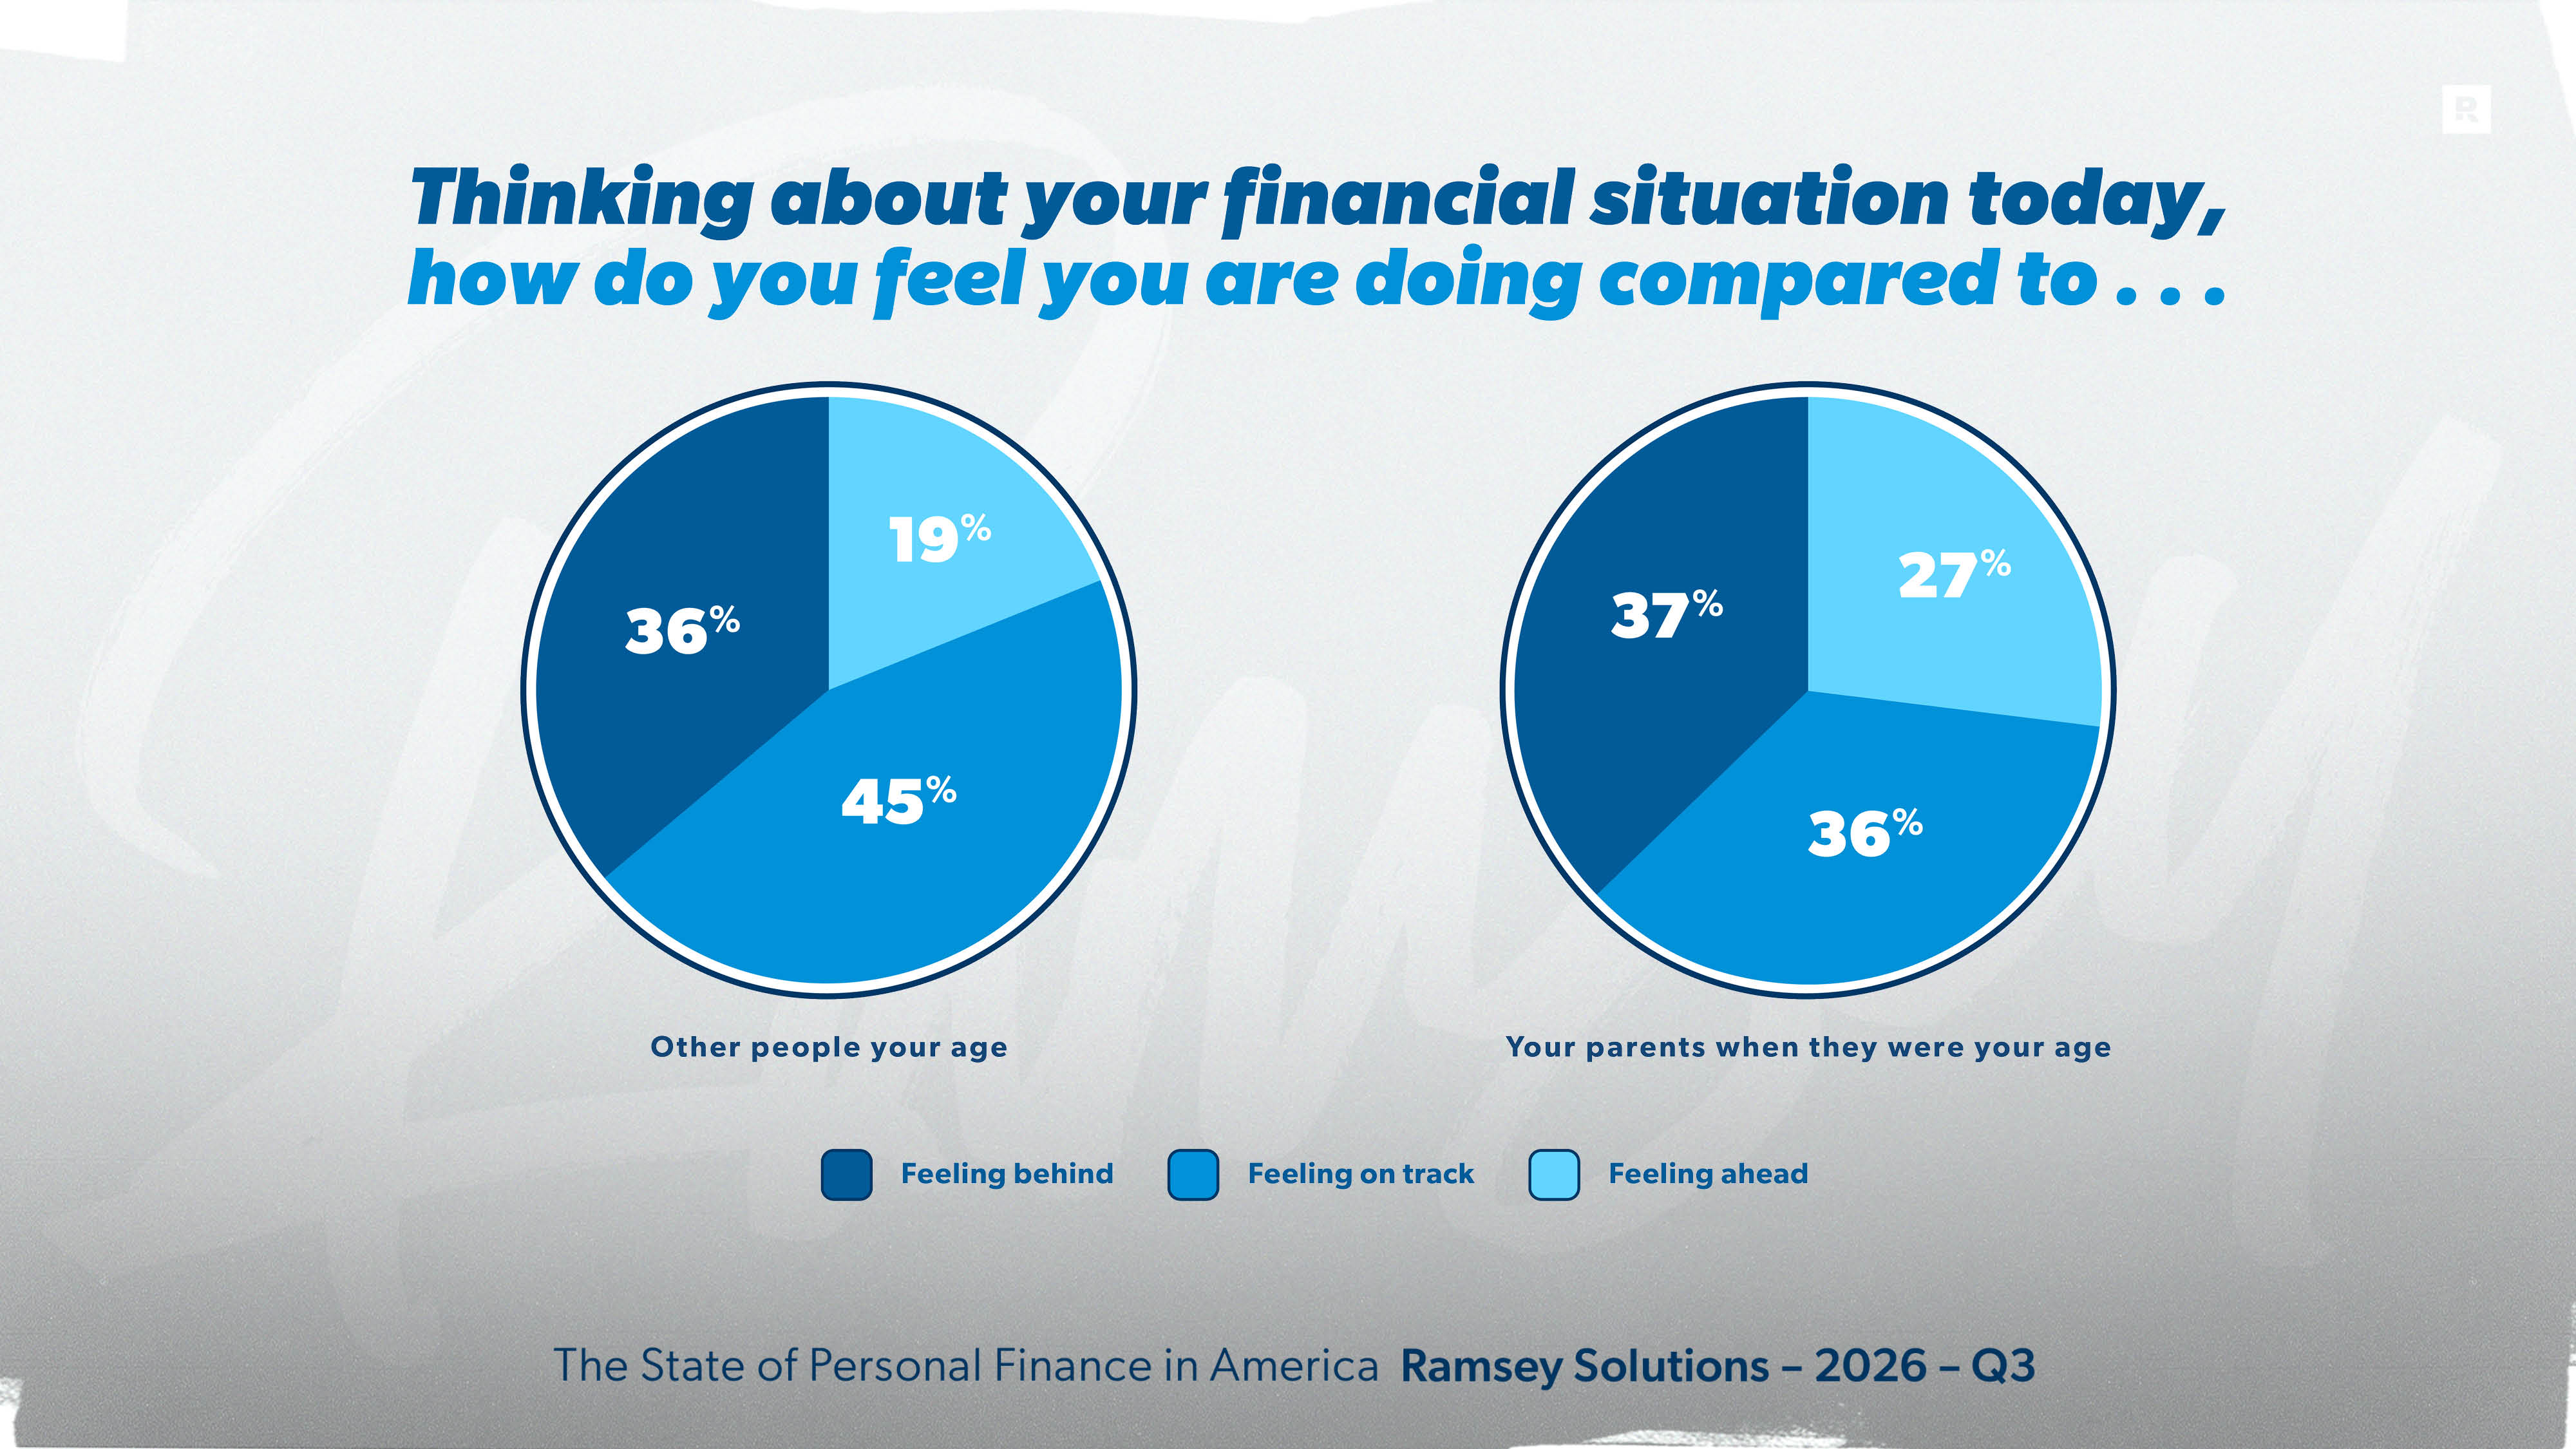
The generational gap really opens up when Americans compare themselves to their parents. Half of Americans (52%) say their parents had it easier financially at their age, including 68% of both Gen Zers and millennials. Only 28% of baby boomers feel that way.
Over 4 in 10 Americans (43%) also feel they have fewer opportunities to build wealth than their parents did. Among Gen Z, that number jumps to 64%, compared to just 19% of baby boomers.
The Everyday Squeeze: Financial Stress Ticks Back Up
Feelings about the economy and personal timelines matter. But the clearest picture of how Americans are really doing comes from the day-to-day stuff. Can you pay the electric bill? Is there enough food in the fridge? Are you lying awake at night doing mental math about next week?
Last quarter, the data told a hopeful story: Nearly every measure of financial stress in this study improved. But this quarter, most of that progress disappeared. Americans’ happiness with their current money situation dropped sharply, from 56% in Q2 to 48% in Q3. Last quarter’s number had been the highest in nearly three years of tracking.
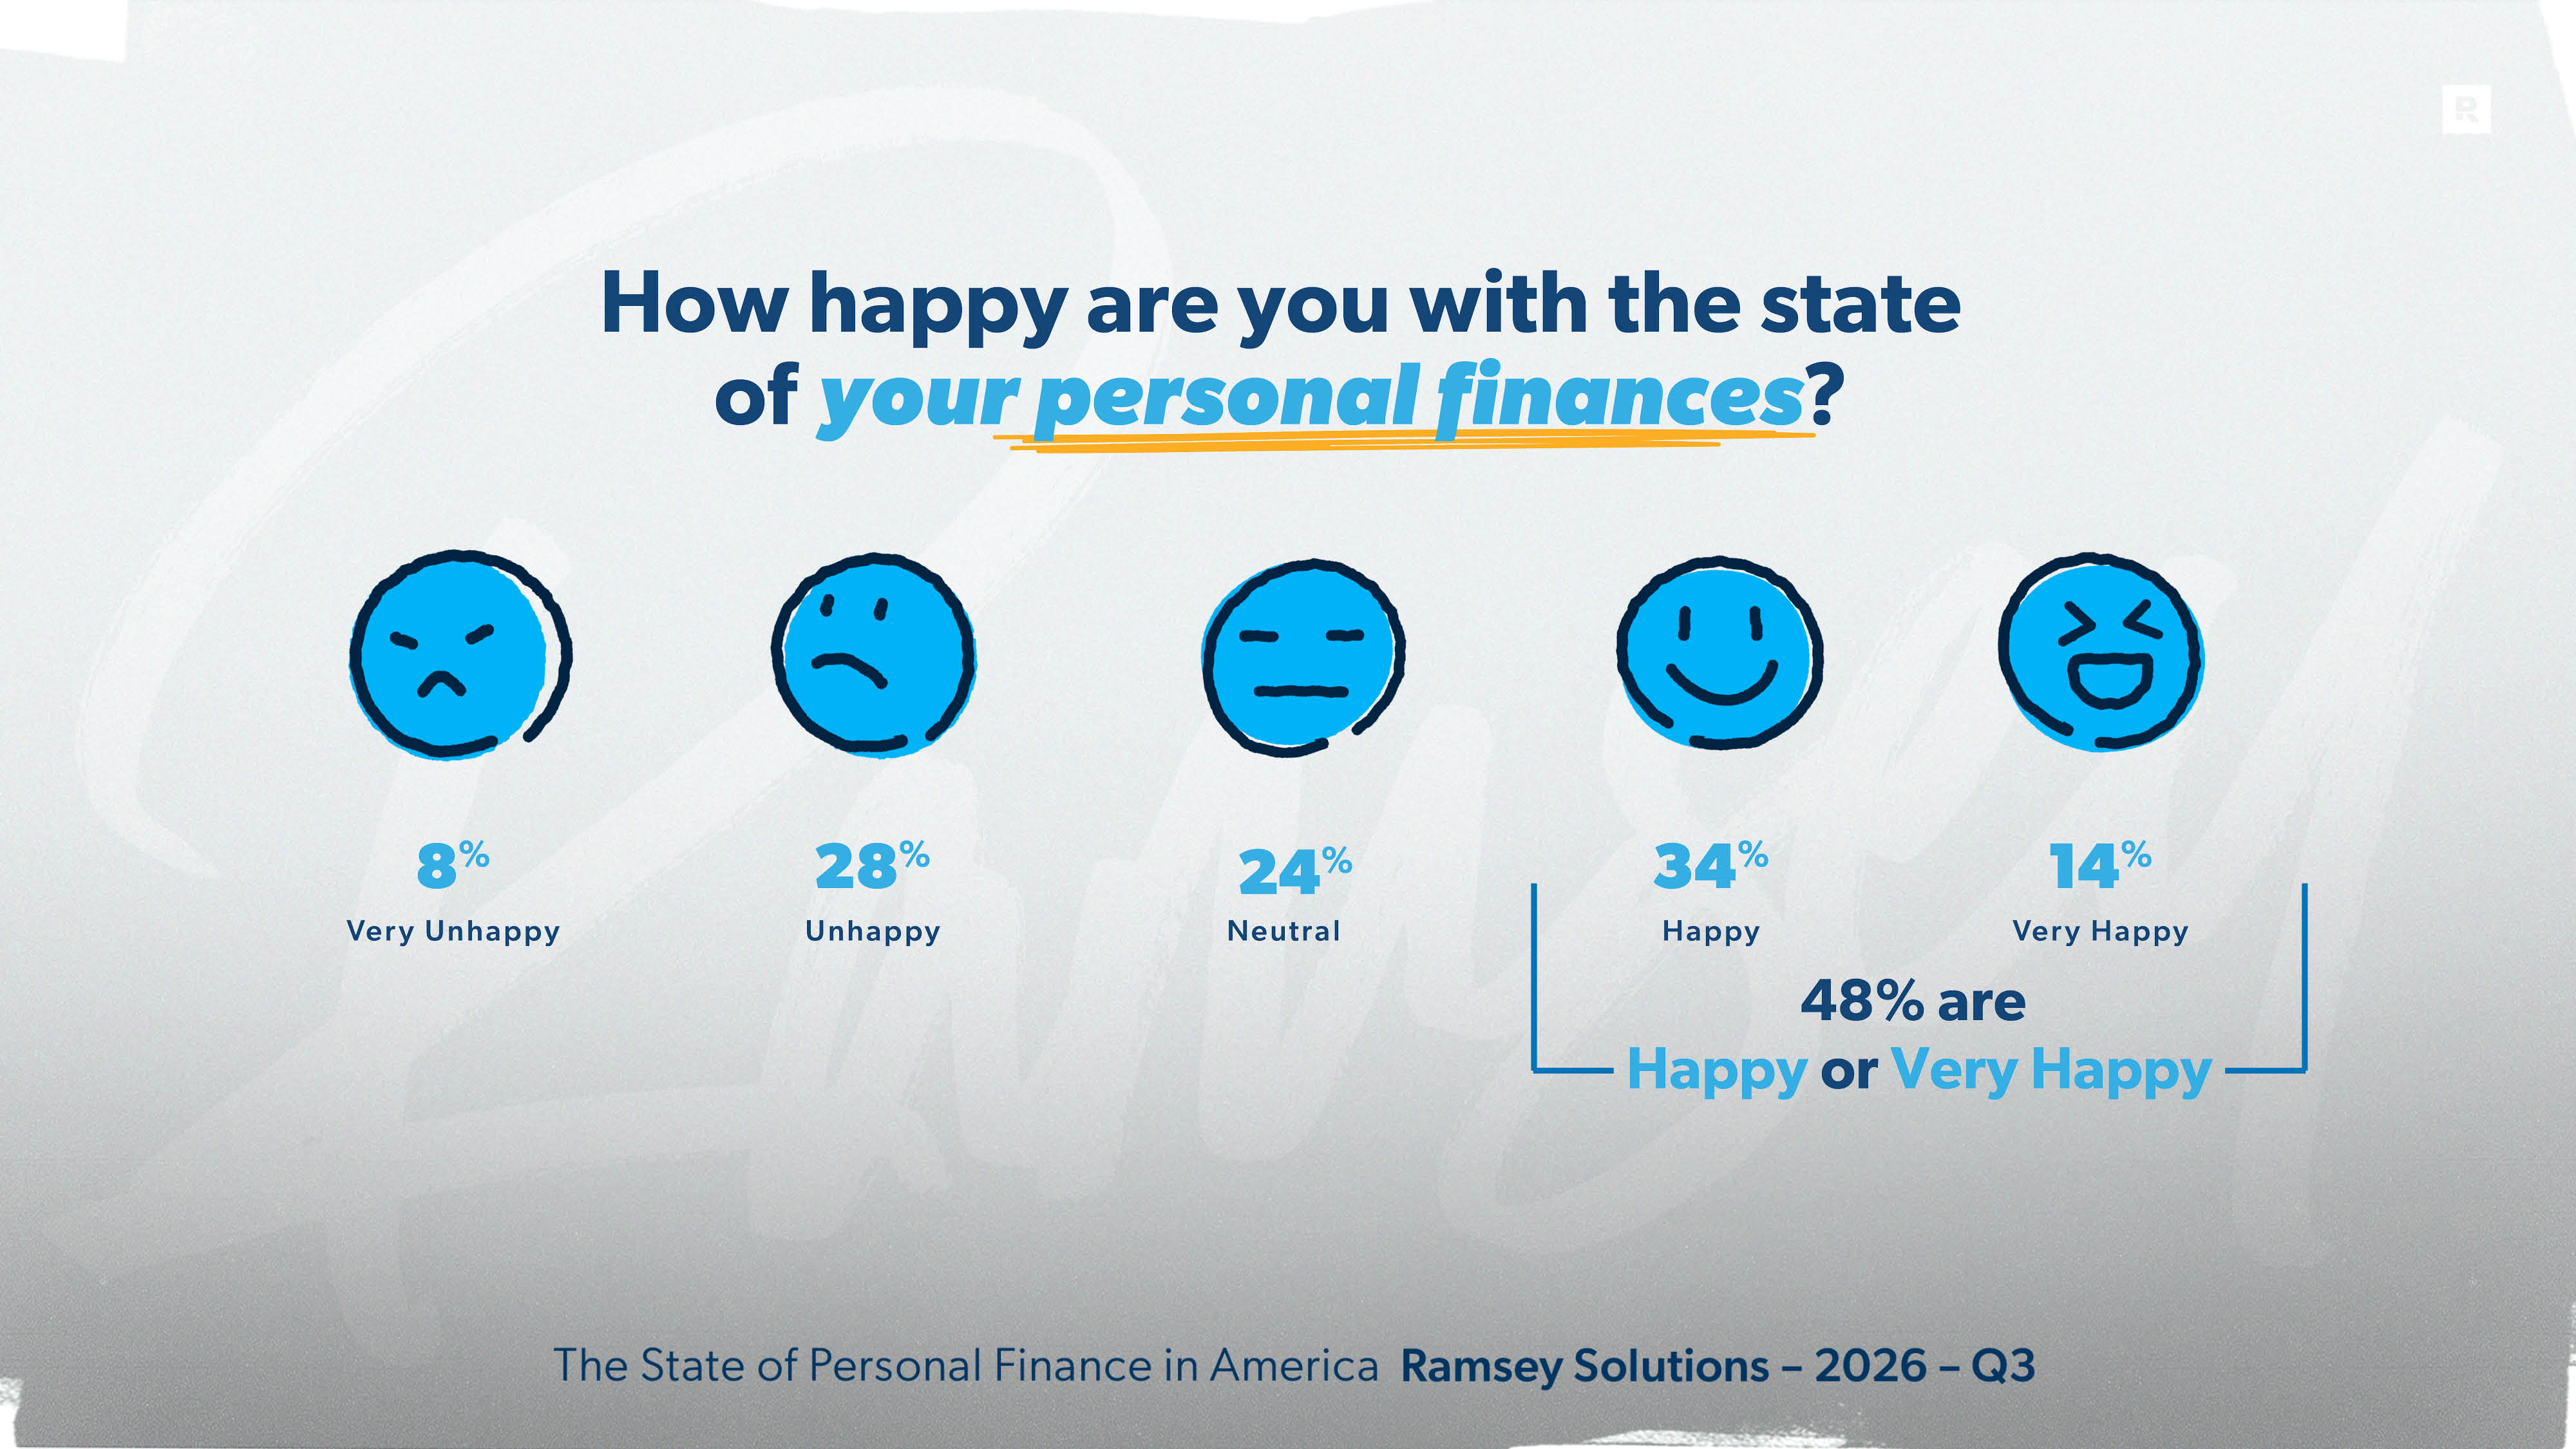
Who’s happiest? Men (56% vs. 42% of women), baby boomers (59%), and households earning over $100,000 (68%). Debt-free Americans are far happier with their finances than those carrying consumer debt (63% vs. 40%). And those that also report more happiness with their finances include married Americans (58% vs. 40% of singles), college graduates (60% vs. 37% of those without a college degree) and church attenders (56% vs. 46% of non-attenders).
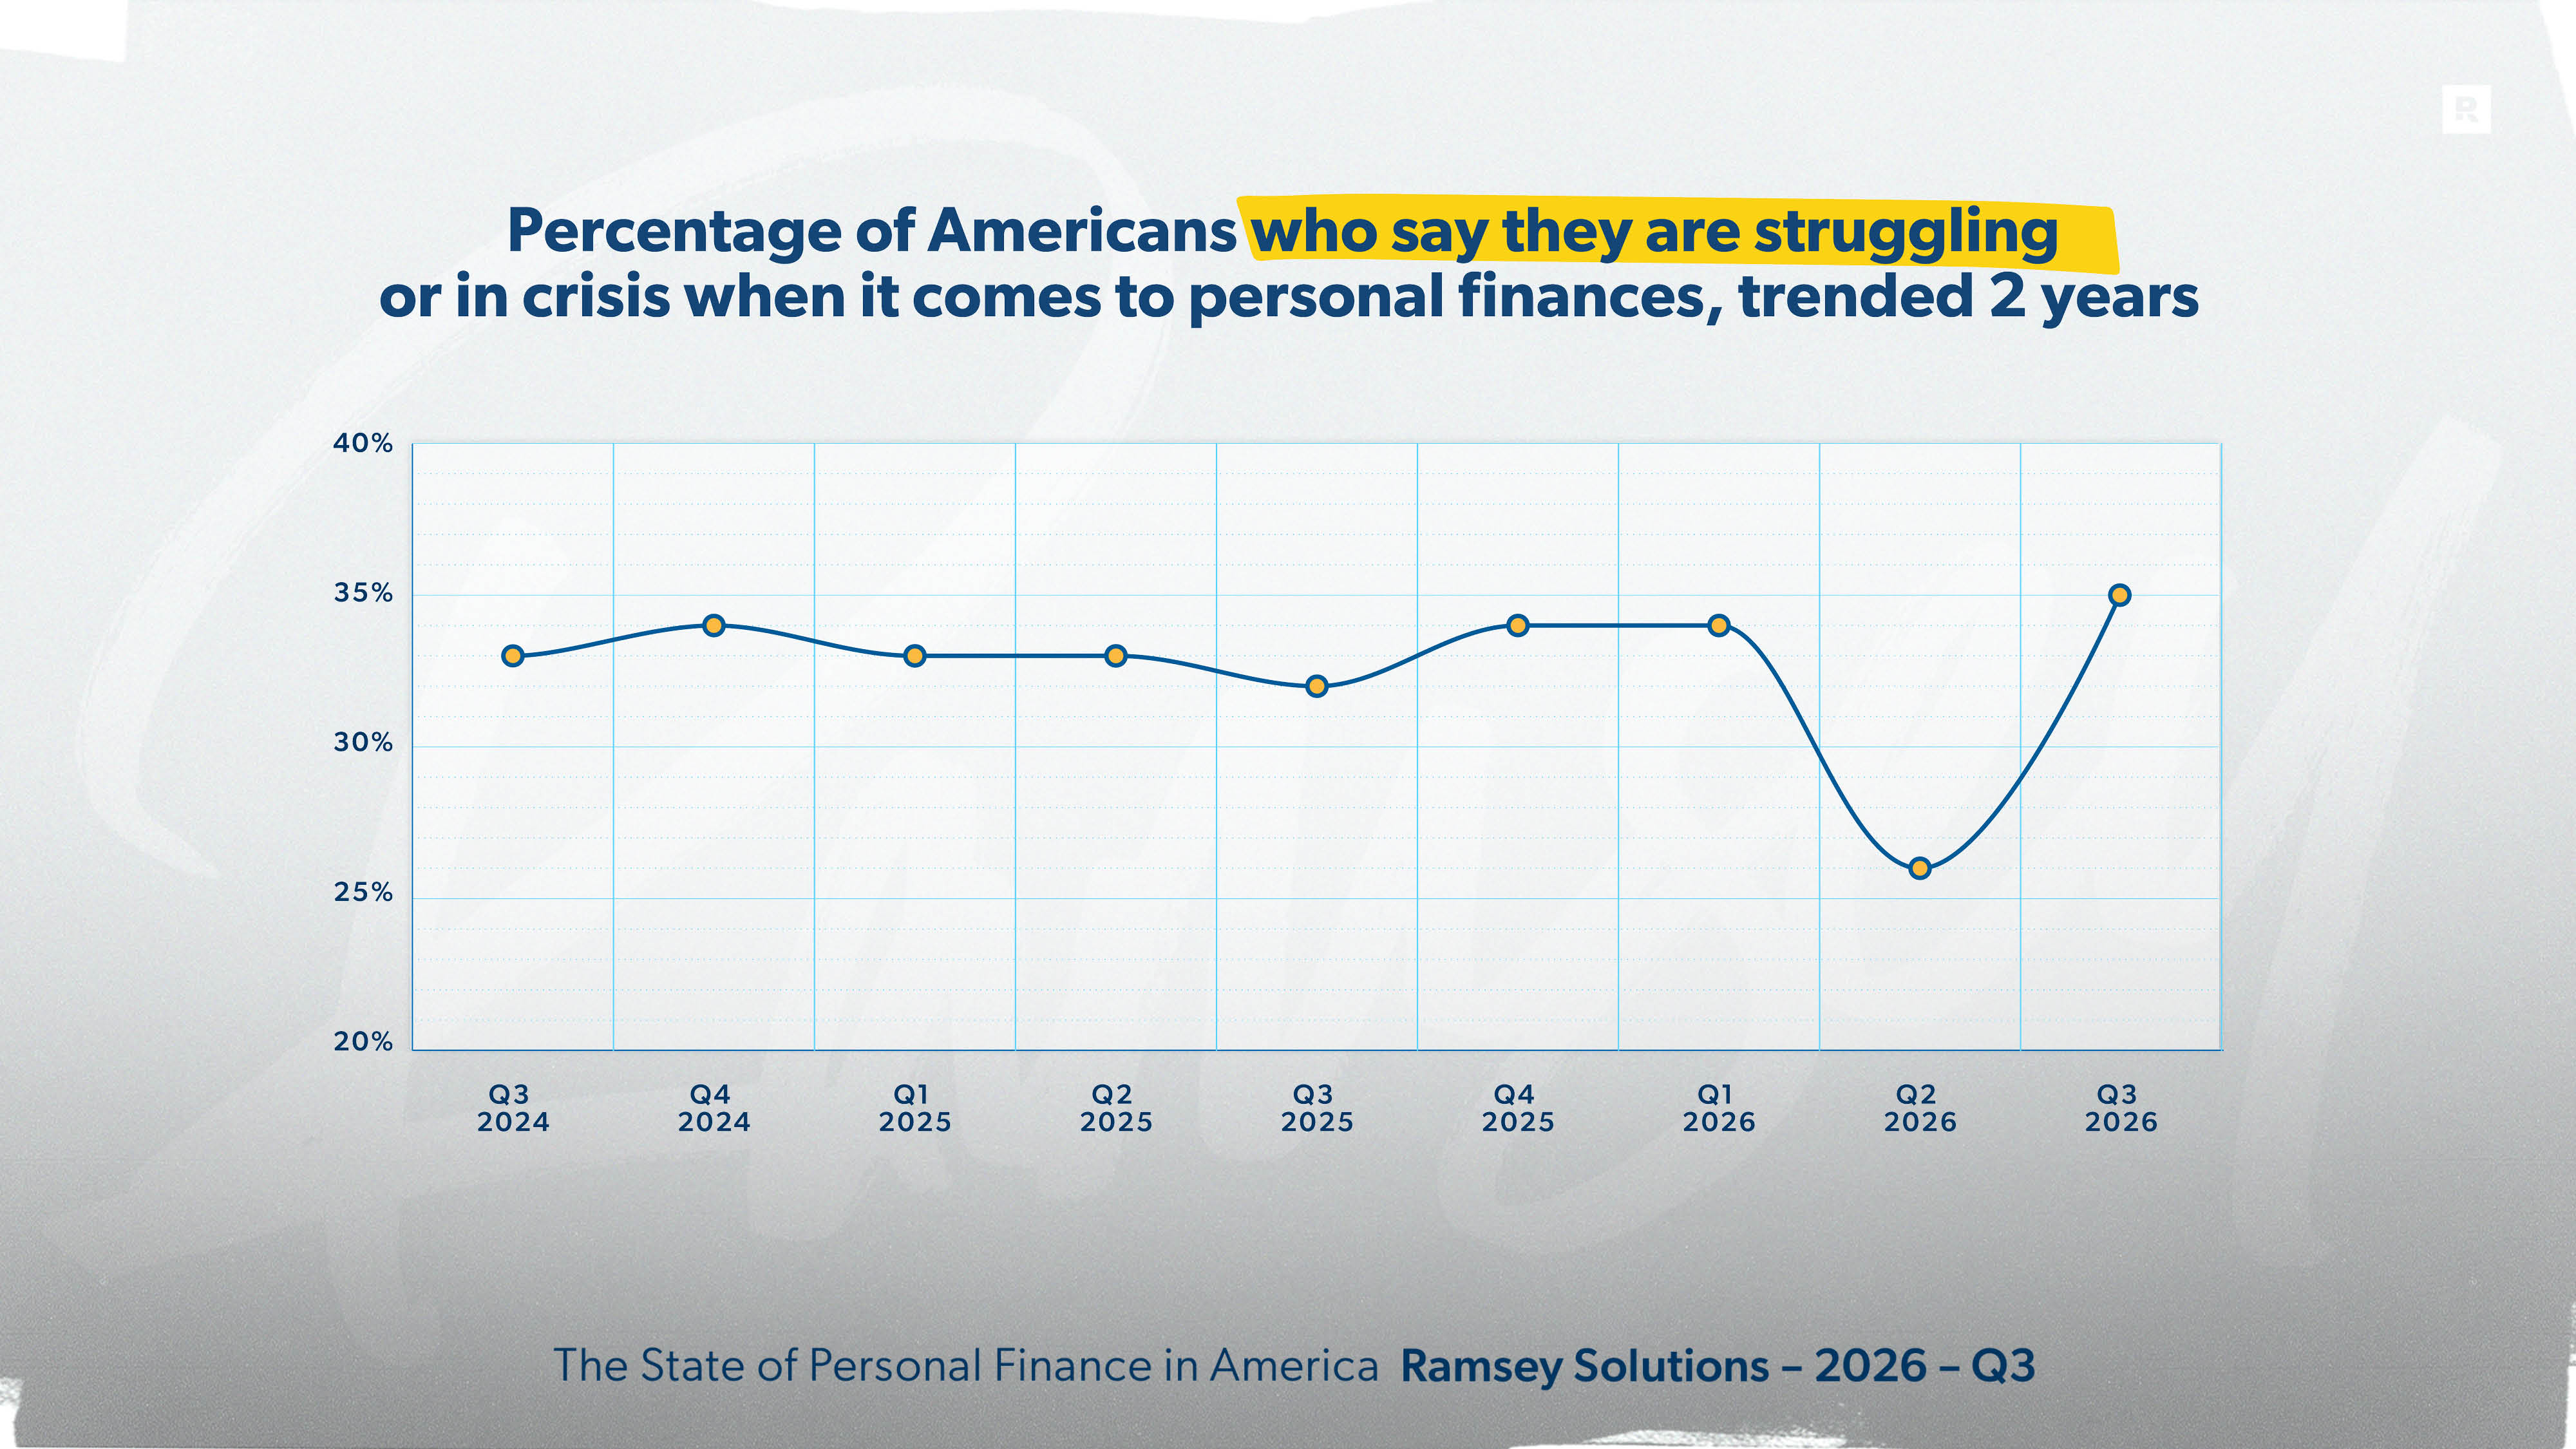
At the same time, the share of Americans who say they’re struggling or in crisis financially jumped from 26% to 35%, or about 94 million U.S. adults. That puts the numbers back in line with (and slightly above) the levels seen through most of 2024 and 2025. More than half of those earning under $50,000 (58%) say they’re struggling, along with 44% of those with consumer debt. Also among the most likely to struggle are singles (43%), those with a high school education or less (50%), Americans who don’t attend church (39%), and rural Americans (42%).
That squeeze is showing up in the basics. Almost half of Americans (48%) had difficulty paying their bills in the past three months, up from 38% in Q2. And 4 in 10 (40%) had trouble providing food, up from 29%. Both numbers are still below the highs of 2022 (when as many as 56% struggled with bills), but they’re headed in the wrong direction.
Housing costs are adding pressure too. More than half of renters (54%) struggled to make rent in the past three months, up from 41% in Q2. And over a third of homeowners (36%) had trouble making their mortgage payment, up from 29%.
When the basics get harder to cover, other bills start slipping. One in 3 Americans (32%) paid a bill late in the past three months, up from 28% last quarter. That number climbs to half (50%) of households earning under $50,000.
Just over half of Americans (53%) say they’re living paycheck to paycheck, up from 46% in Q2. For households earning under $50,000, it’s nearly 8 in 10 (78%). And 65% of those with consumer debt say they’re spending nearly everything they make.
All that stress follows people home at night. Half of Americans (51%) say they worry about their finances every day, up from 47%. And 39% say money has caused them to lose sleep in the past three months, up from 32%.
There are still some signs of resilience. Three in 10 Americans (30%) say they’re better off financially than they were a year ago—up from 27% last quarter. And 41% remain very or extremely optimistic about their financial future. That’s down from 45% in Q2, but it’s right in line with where optimism has hovered for the past two years. Even more encouraging, 59% say they’re very or extremely hopeful they’ll one day achieve their goals with money.
The High Cost of Staying Healthy
When a budget is already stretched thin, it doesn’t take much to break it. And few things expose a thin budget faster than a trip to the doctor. Things like a lingering cough or a prescription refill are often the first things to get pushed to next month. And next month has a way of turning into next year.
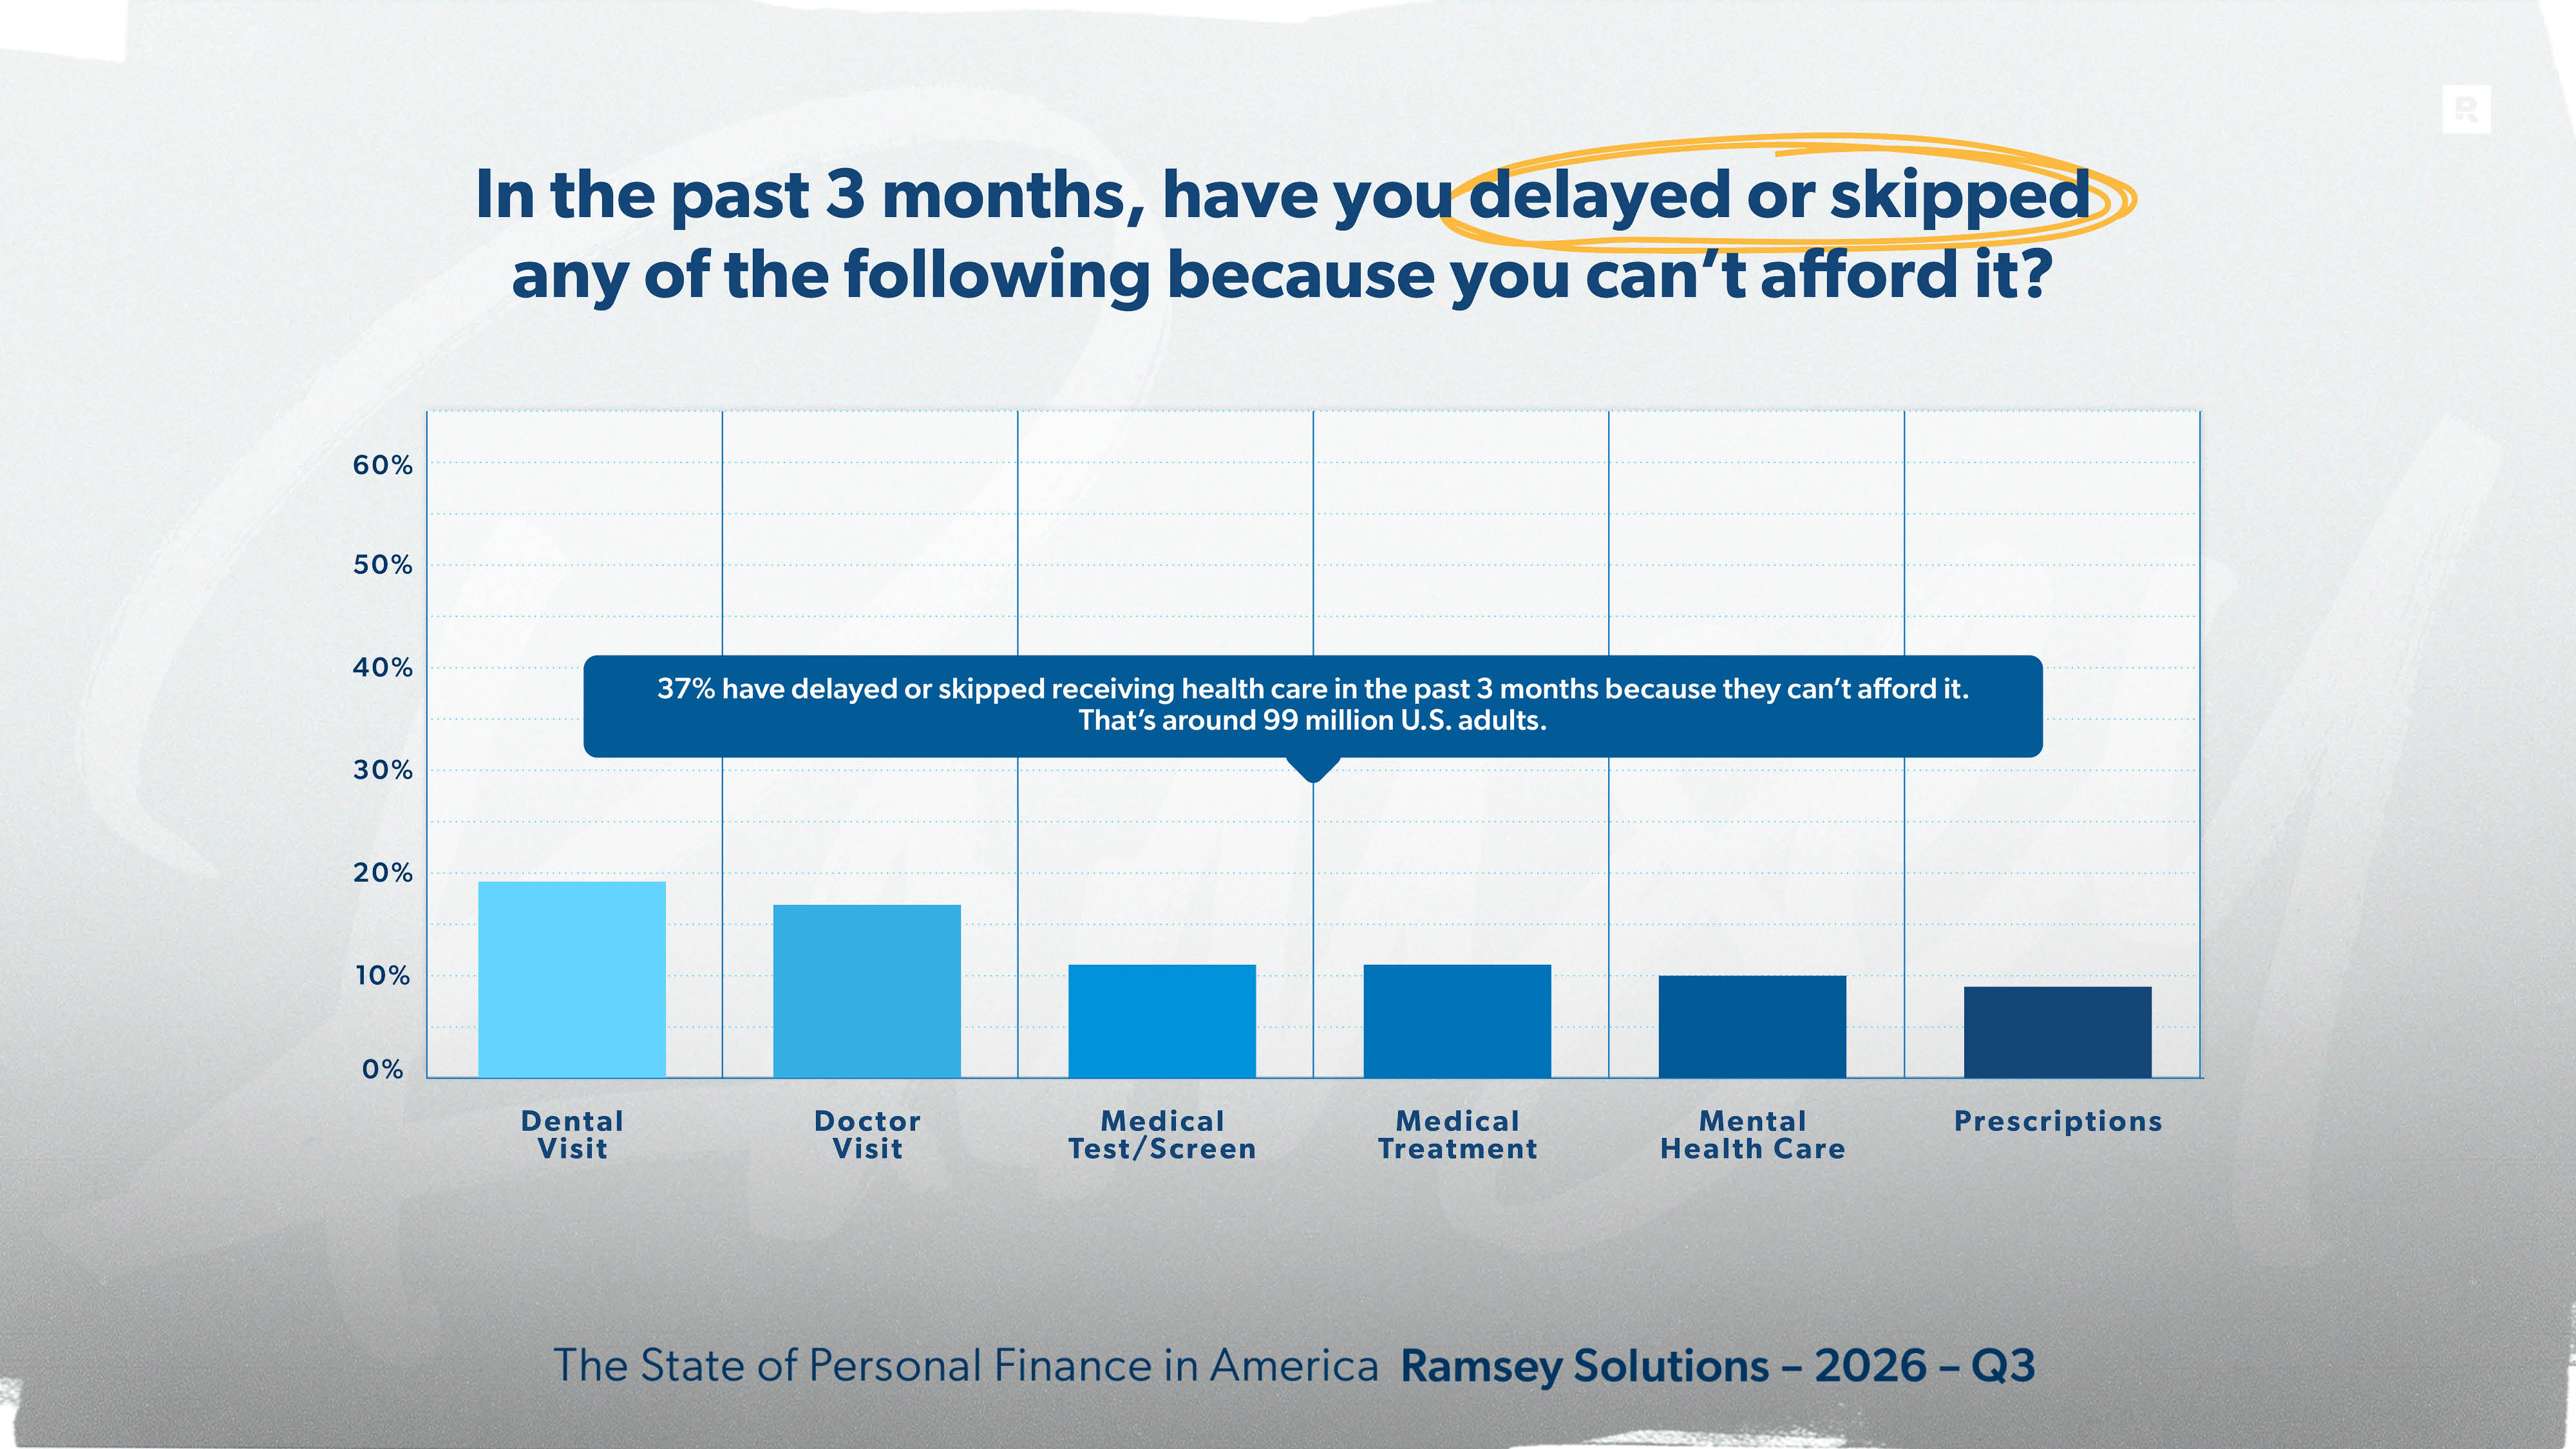
An estimated 99 million U.S. adults (37%) have delayed or skipped receiving health care in the past three months because they couldn’t afford it. Dental visits top the list (19%), followed by doctor visits (17%), medical tests or screenings (11%), and medical procedures or treatments (11%). One in 10 have put off mental health care (10%), and 9% have delayed filling or refilling a prescription.
Younger Americans are skipping care at the highest rates: 55% of Gen Zers and 52% of millennials have delayed or skipped some kind of care, compared to just 12% of baby boomers. Women (42% vs. 32% of men), households earning under $50,000 (51%), and those with consumer debt (49% vs. 18% of debt-free Americans) are also far more likely to go without.
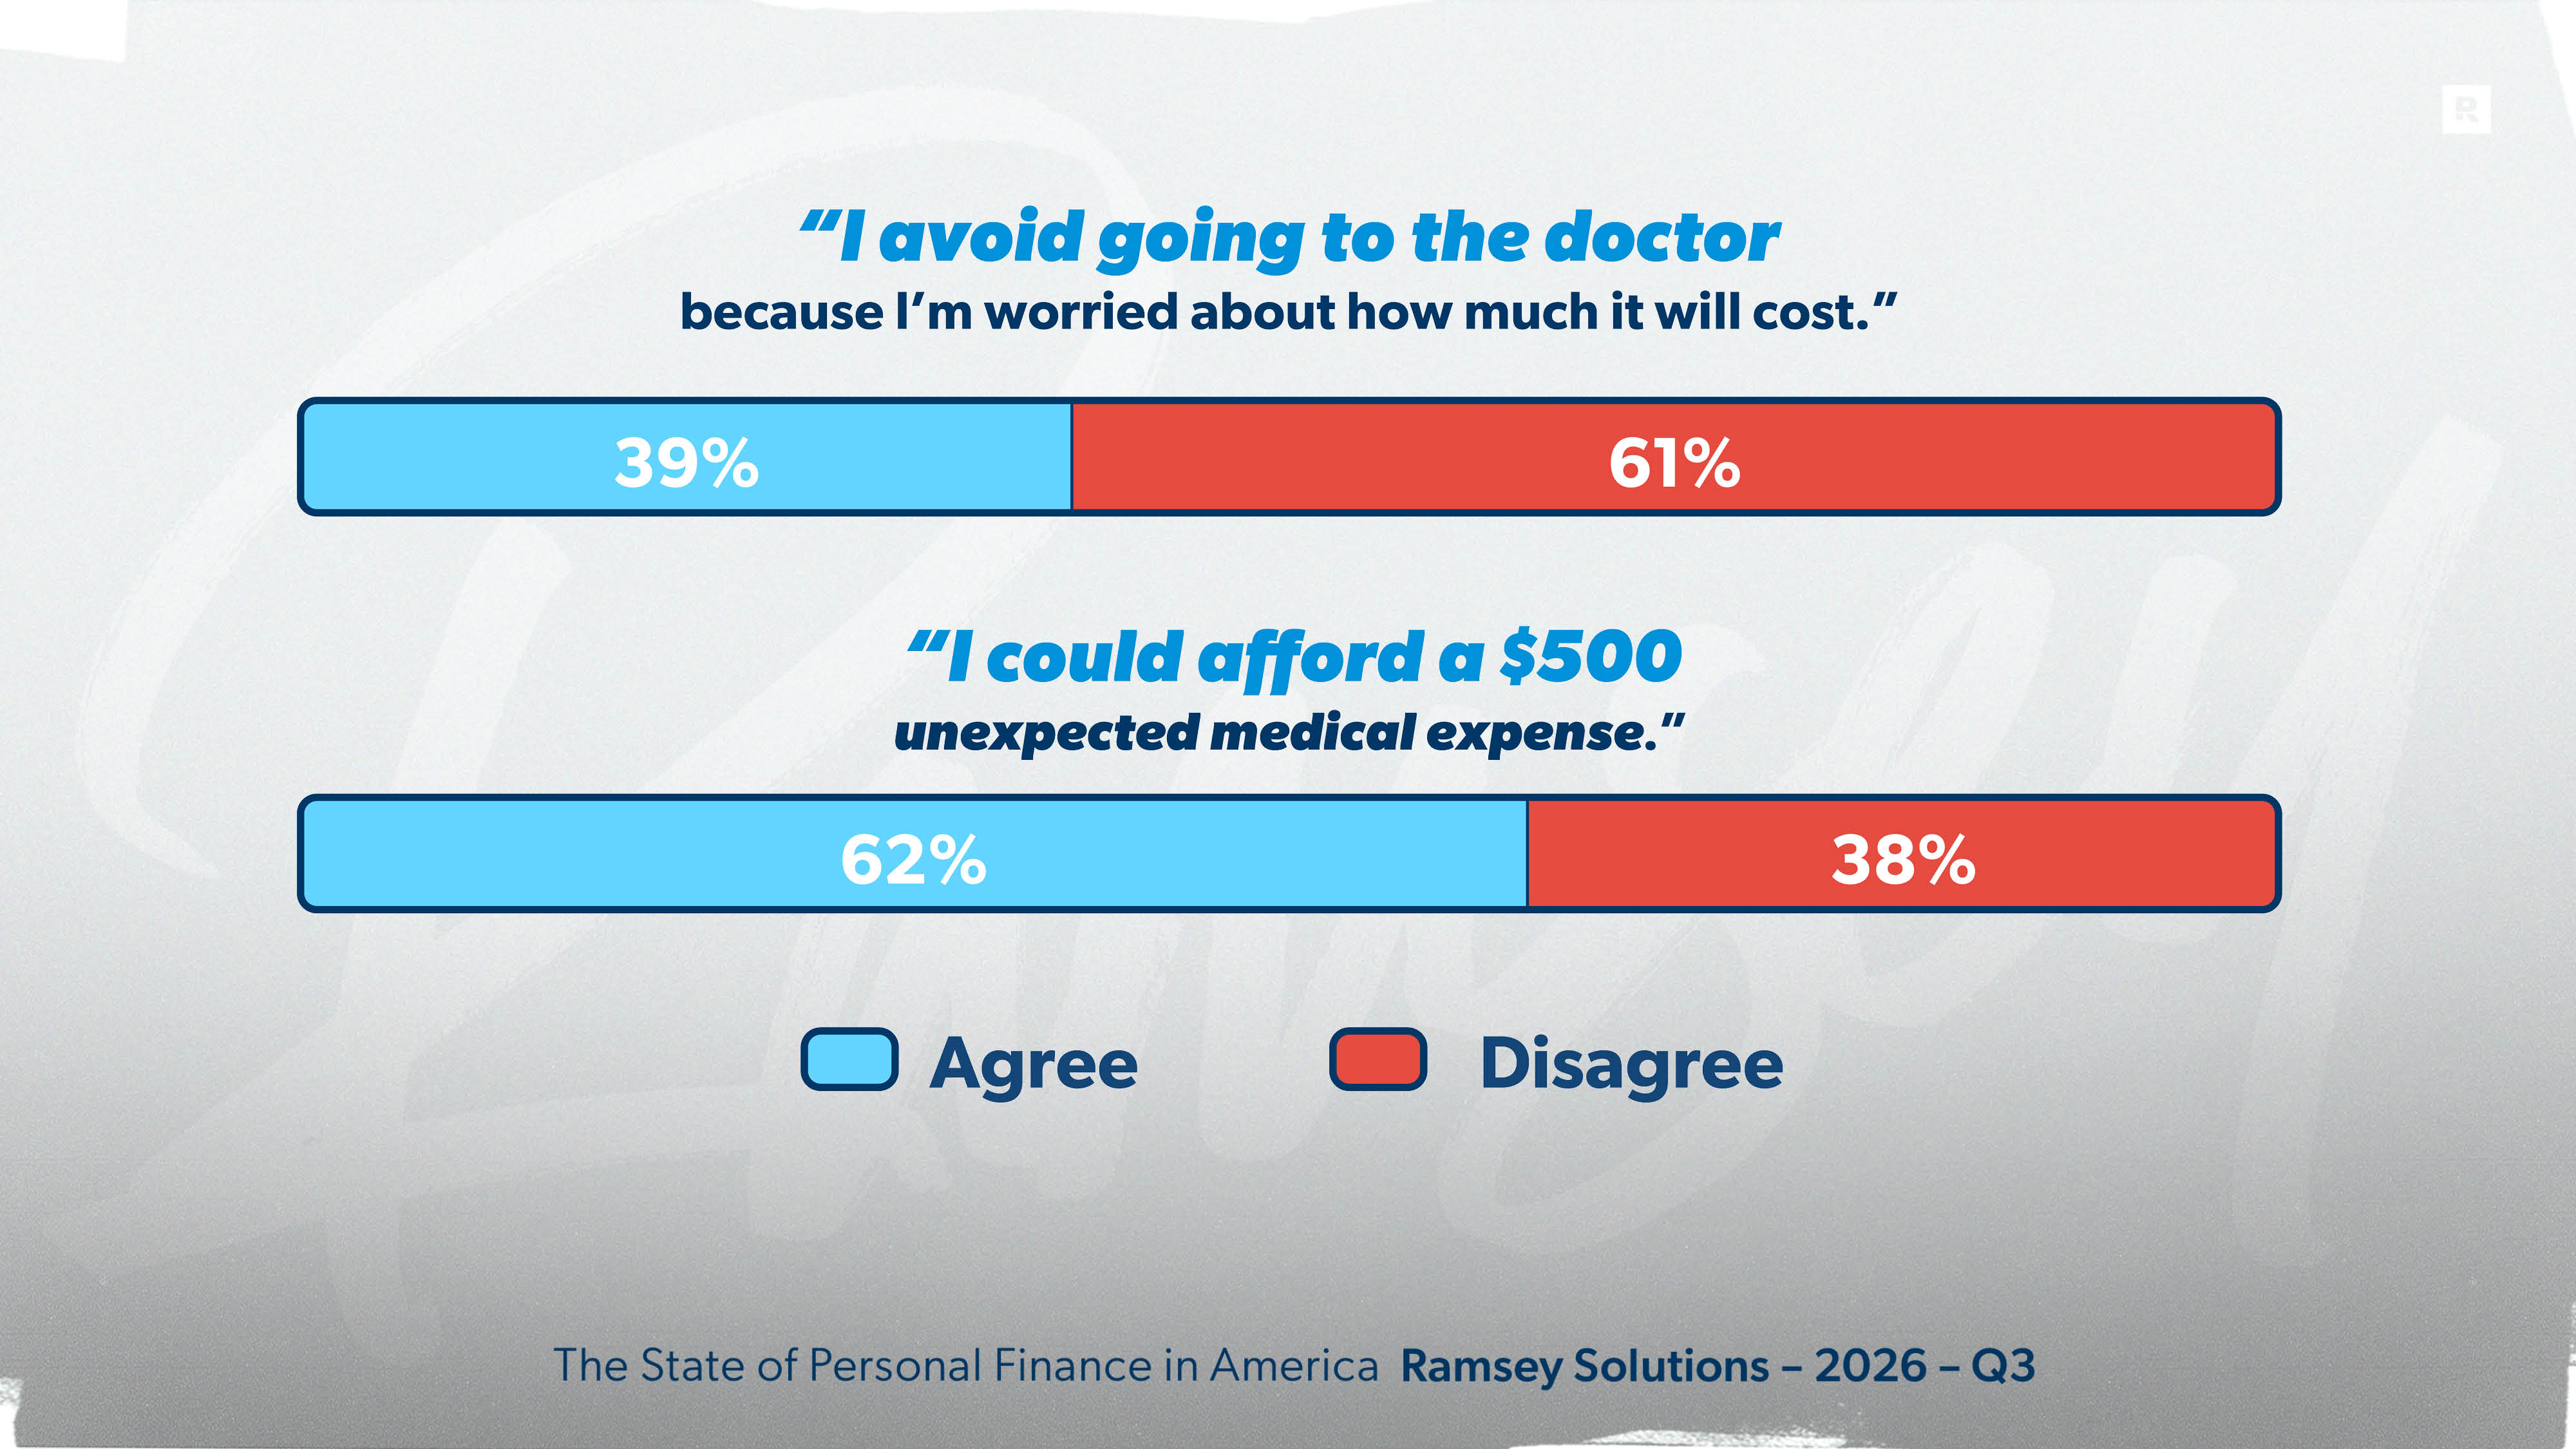
For many, worrying about the cost keeps them from even making the appointment. Four in 10 Americans (39%) say they avoid going to the doctor because they’re worried about how much it will cost, including more than half of Gen Zers (54%), millennials (53%) and those earning under $50,000 (52%).
Part of the problem is a lack of cushion. Six in 10 Americans (62%) say they could afford a $500 unexpected medical expense, which means nearly 4 in 10 couldn’t. Baby boomers (82%) and those earning over $100,000 (82%) are the most likely to be able to cover it. Among millennials, it’s less than half (49%). And among households earning under $50,000, only about a third (36%) could handle a $500 surprise.
When the bill comes due, a lot of Americans are turning to debt. One-third (35%) have gone into debt to pay for a medical expense in the past 12 months. The most common ways are using a payment plan (16%), putting it on a credit card (15%), borrowing from family or friends (13%), and taking out a loan (6%). Millennials (51%) and Gen Zers (49%) are the most likely to go into debt for medical costs.
Money and Marriage: On the Same Page, Mostly
Money stress doesn’t stay in the checking account. It follows people home and works its way into conversations between spouses.
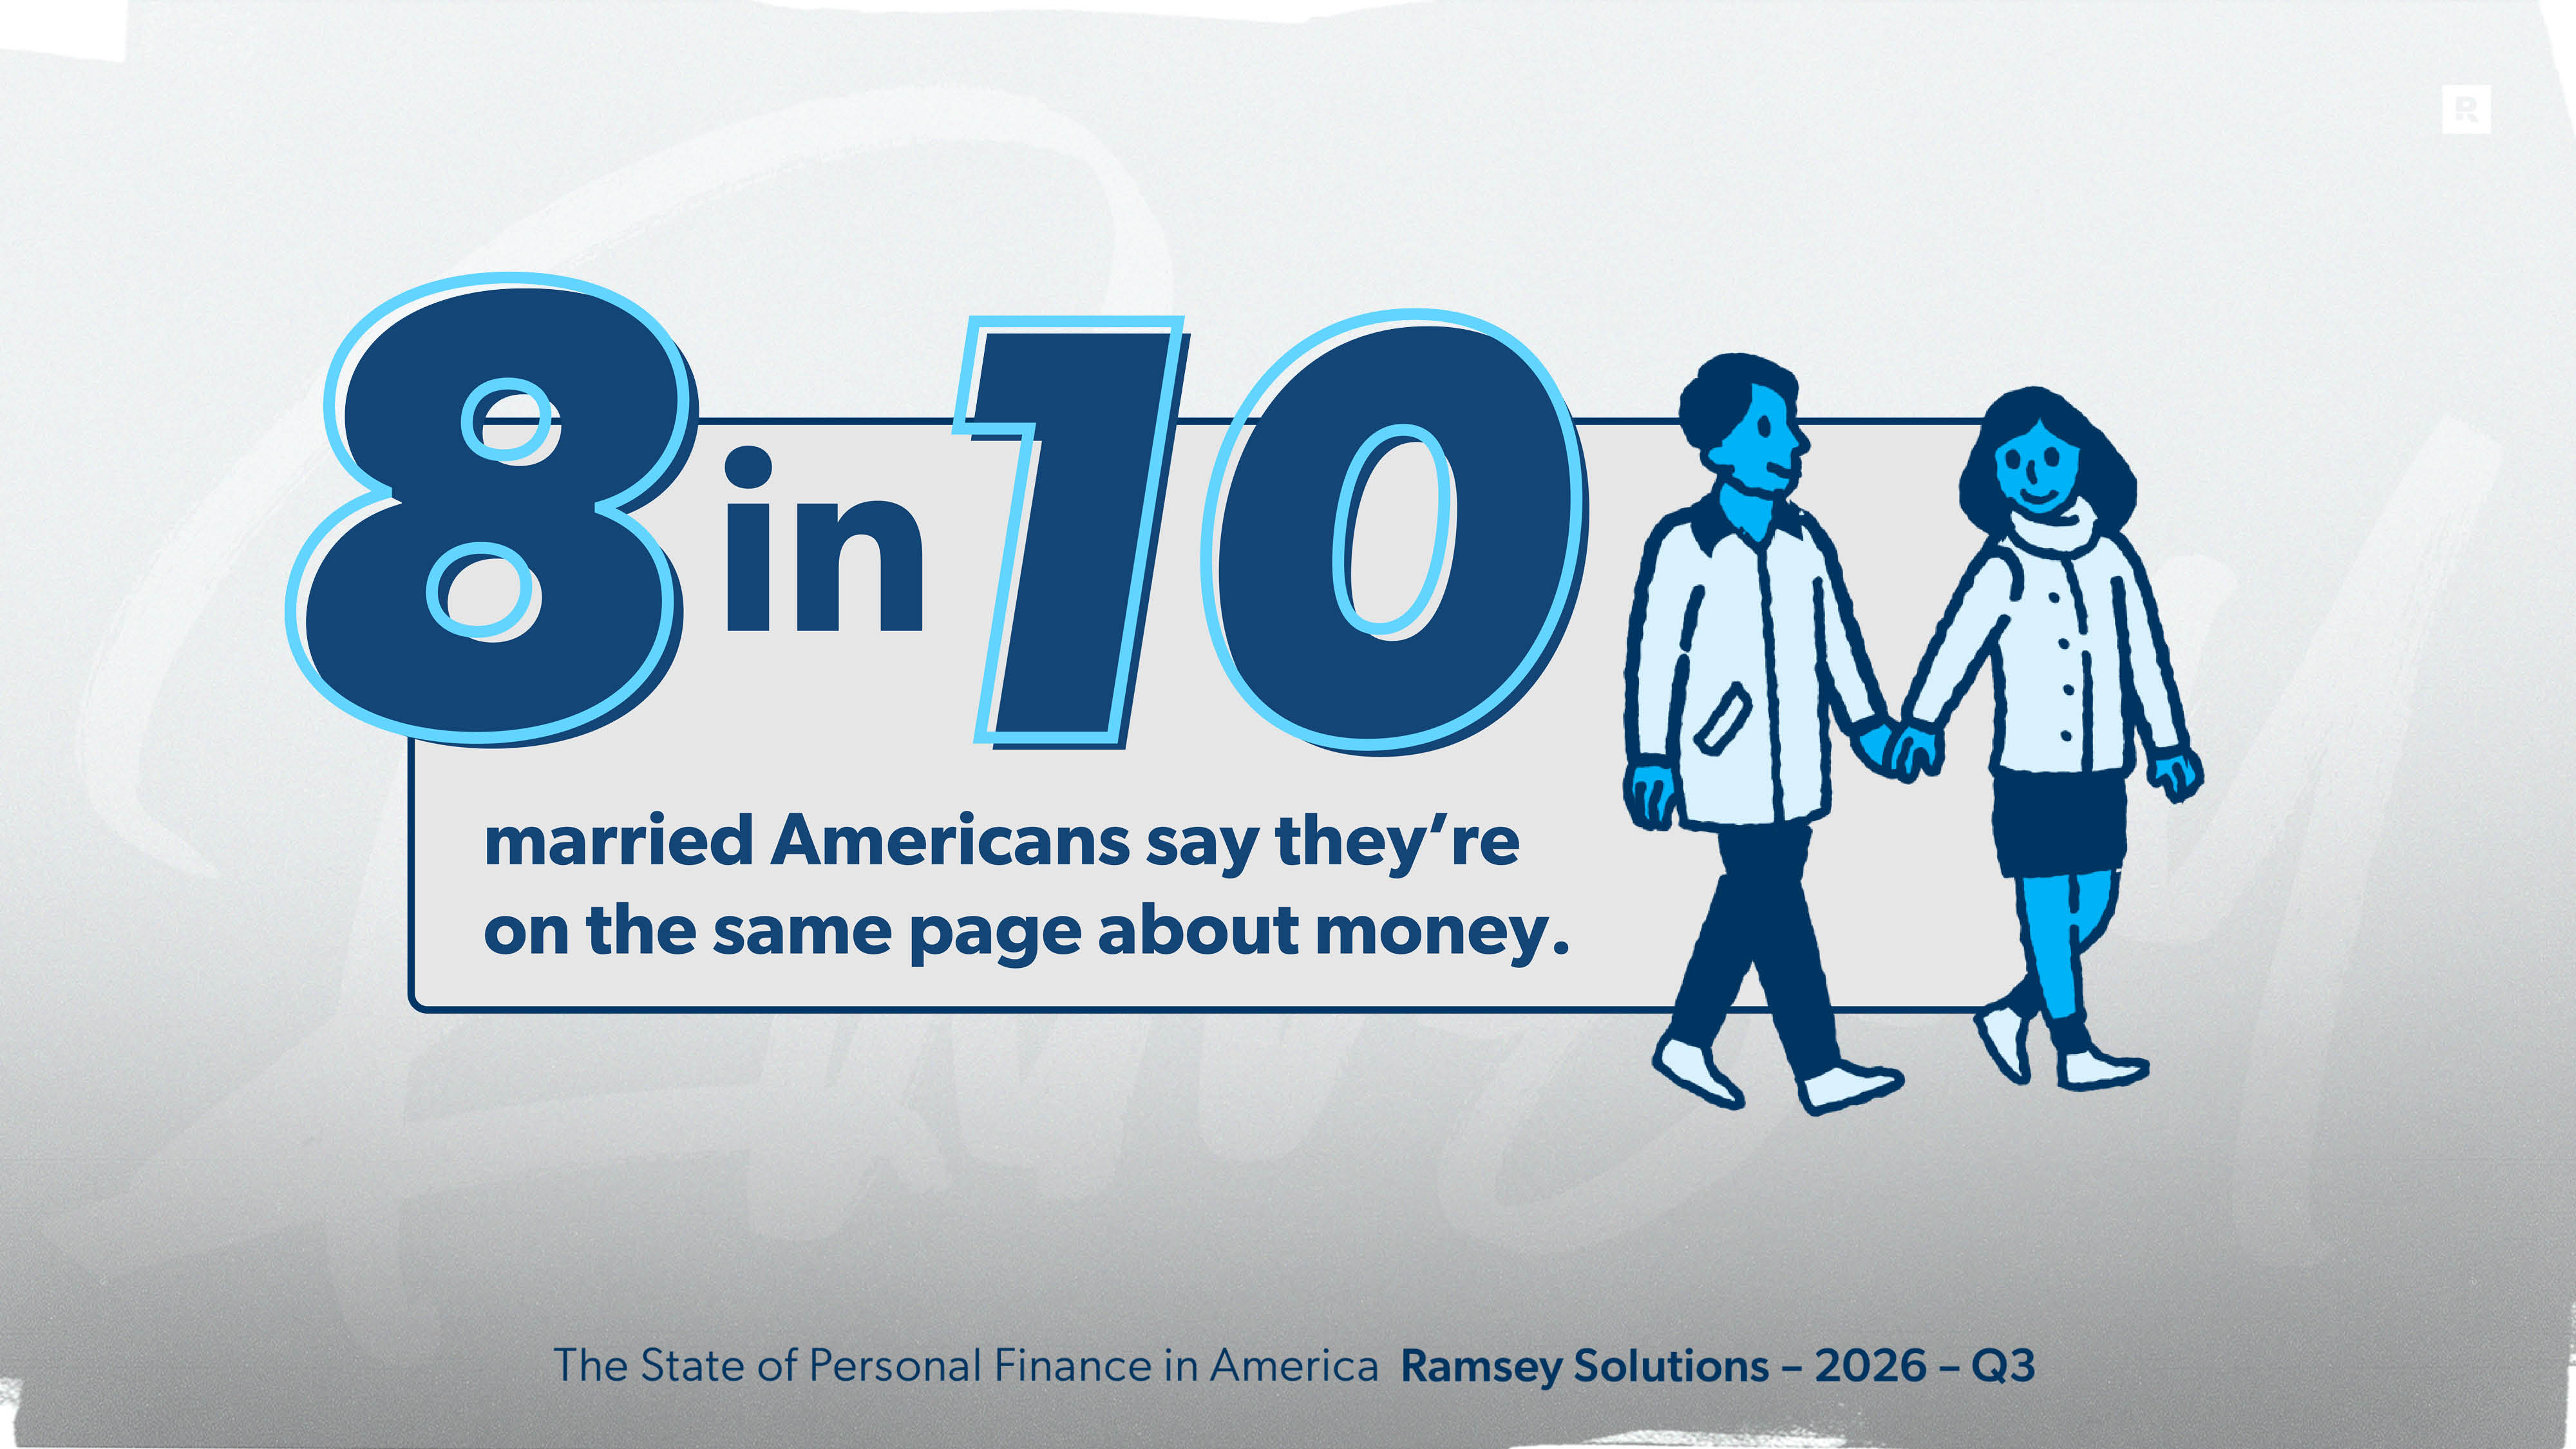
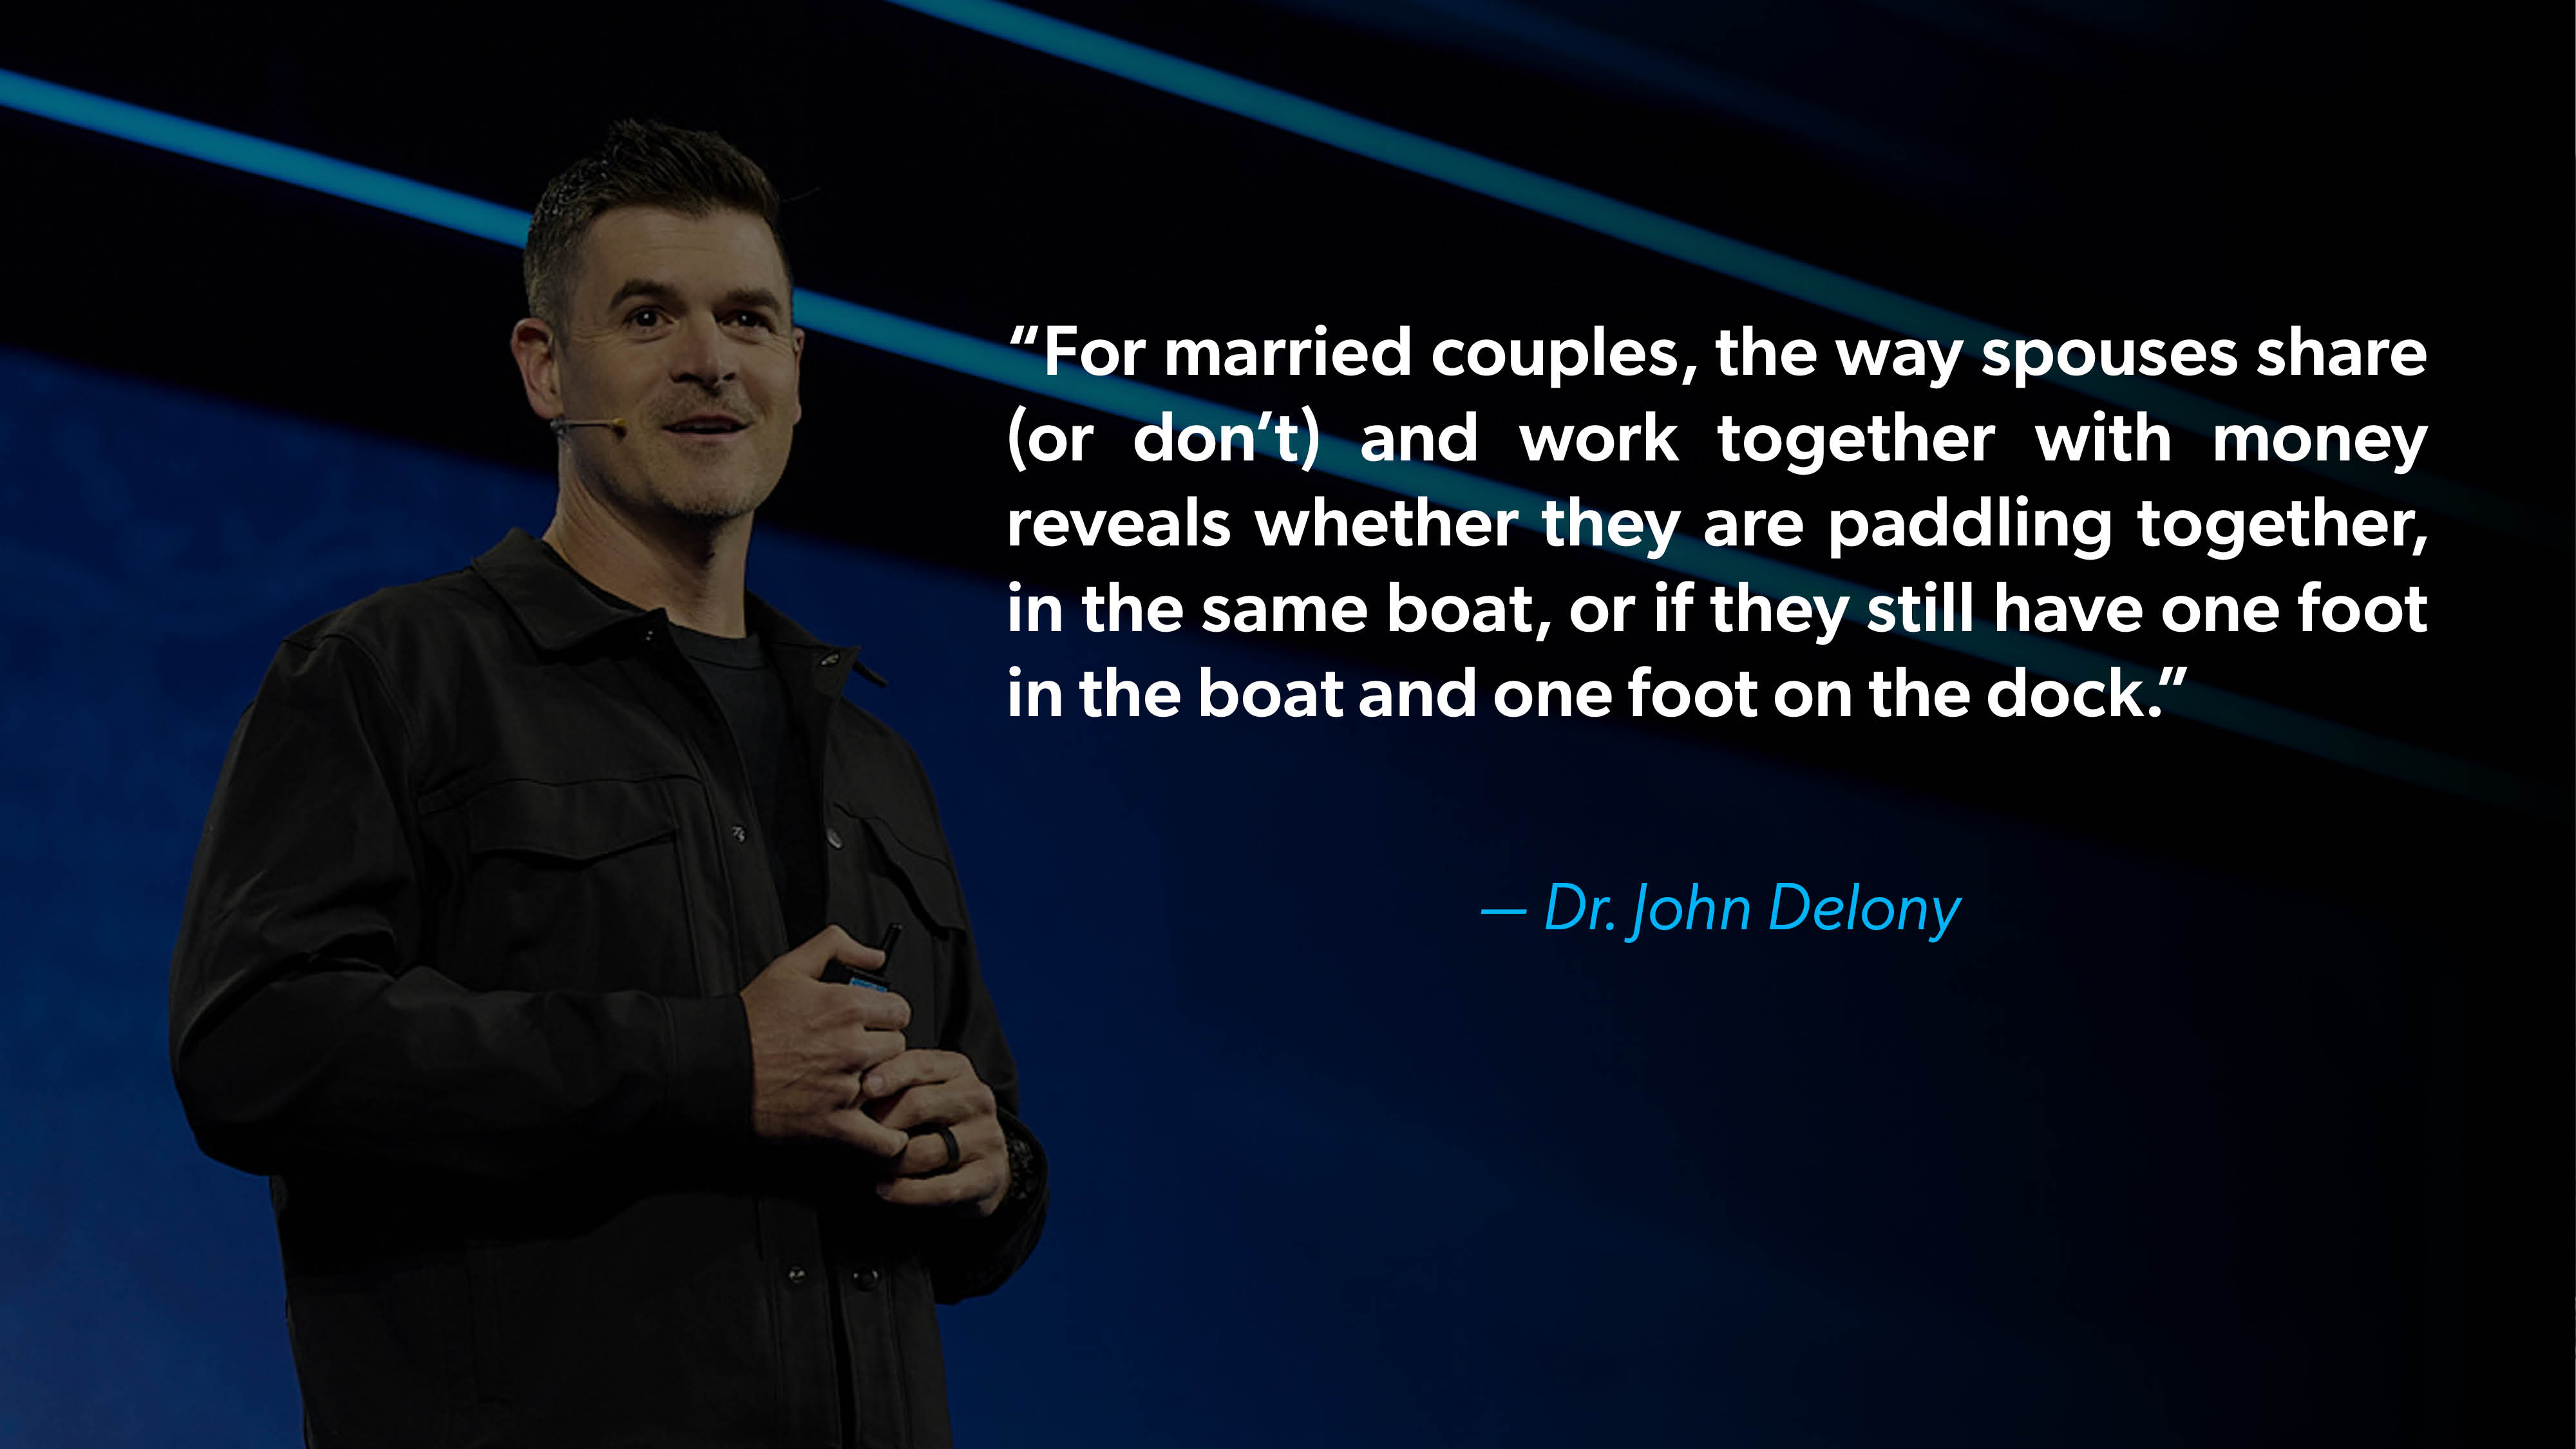
This quarter’s results start on a bright note: Eight in 10 married Americans (80%) say they and their spouse are on the same page with their money. Men are a bit more likely to feel aligned financially than women (85% vs. 76%). Gen Zers (89%) and baby boomers (86%) are the most likely generations to say they’re working toward the same money goals, while millennials trail at 73%. Households earning over $100,000 (86%) and debt-free couples (88%) also report being on the same page more often.
The connection to marriage quality is hard to miss. Among those who rate their marriage as great, 89% say they’re on the same page with money. Among those who describe their marriage as okay, fair or poor, it’s just 45%.
Being on the same page doesn’t always mean splitting the work evenly. Three in 10 married Americans (30%) feel like they’re the only one paying attention to the money in their marriage. Women (35% vs. 25% of men), millennials (42%) and those with consumer debt (36%) are the most likely to feel that way.
Even in marriages that feel aligned, there’s some frustration. Four in 10 married Americans (40%) wish their spouse was better with money. That rises to 54% among millennials and a whopping 71% among those in okay, fair or poor marriages.
And some spending is happening behind closed doors. One in 4 married Americans (25%) say they’ve bought something for themselves and kept it a secret from their spouse. One in 3 (34%) would feel comfortable spending $250 or more on a single purchase without talking to their spouse first.
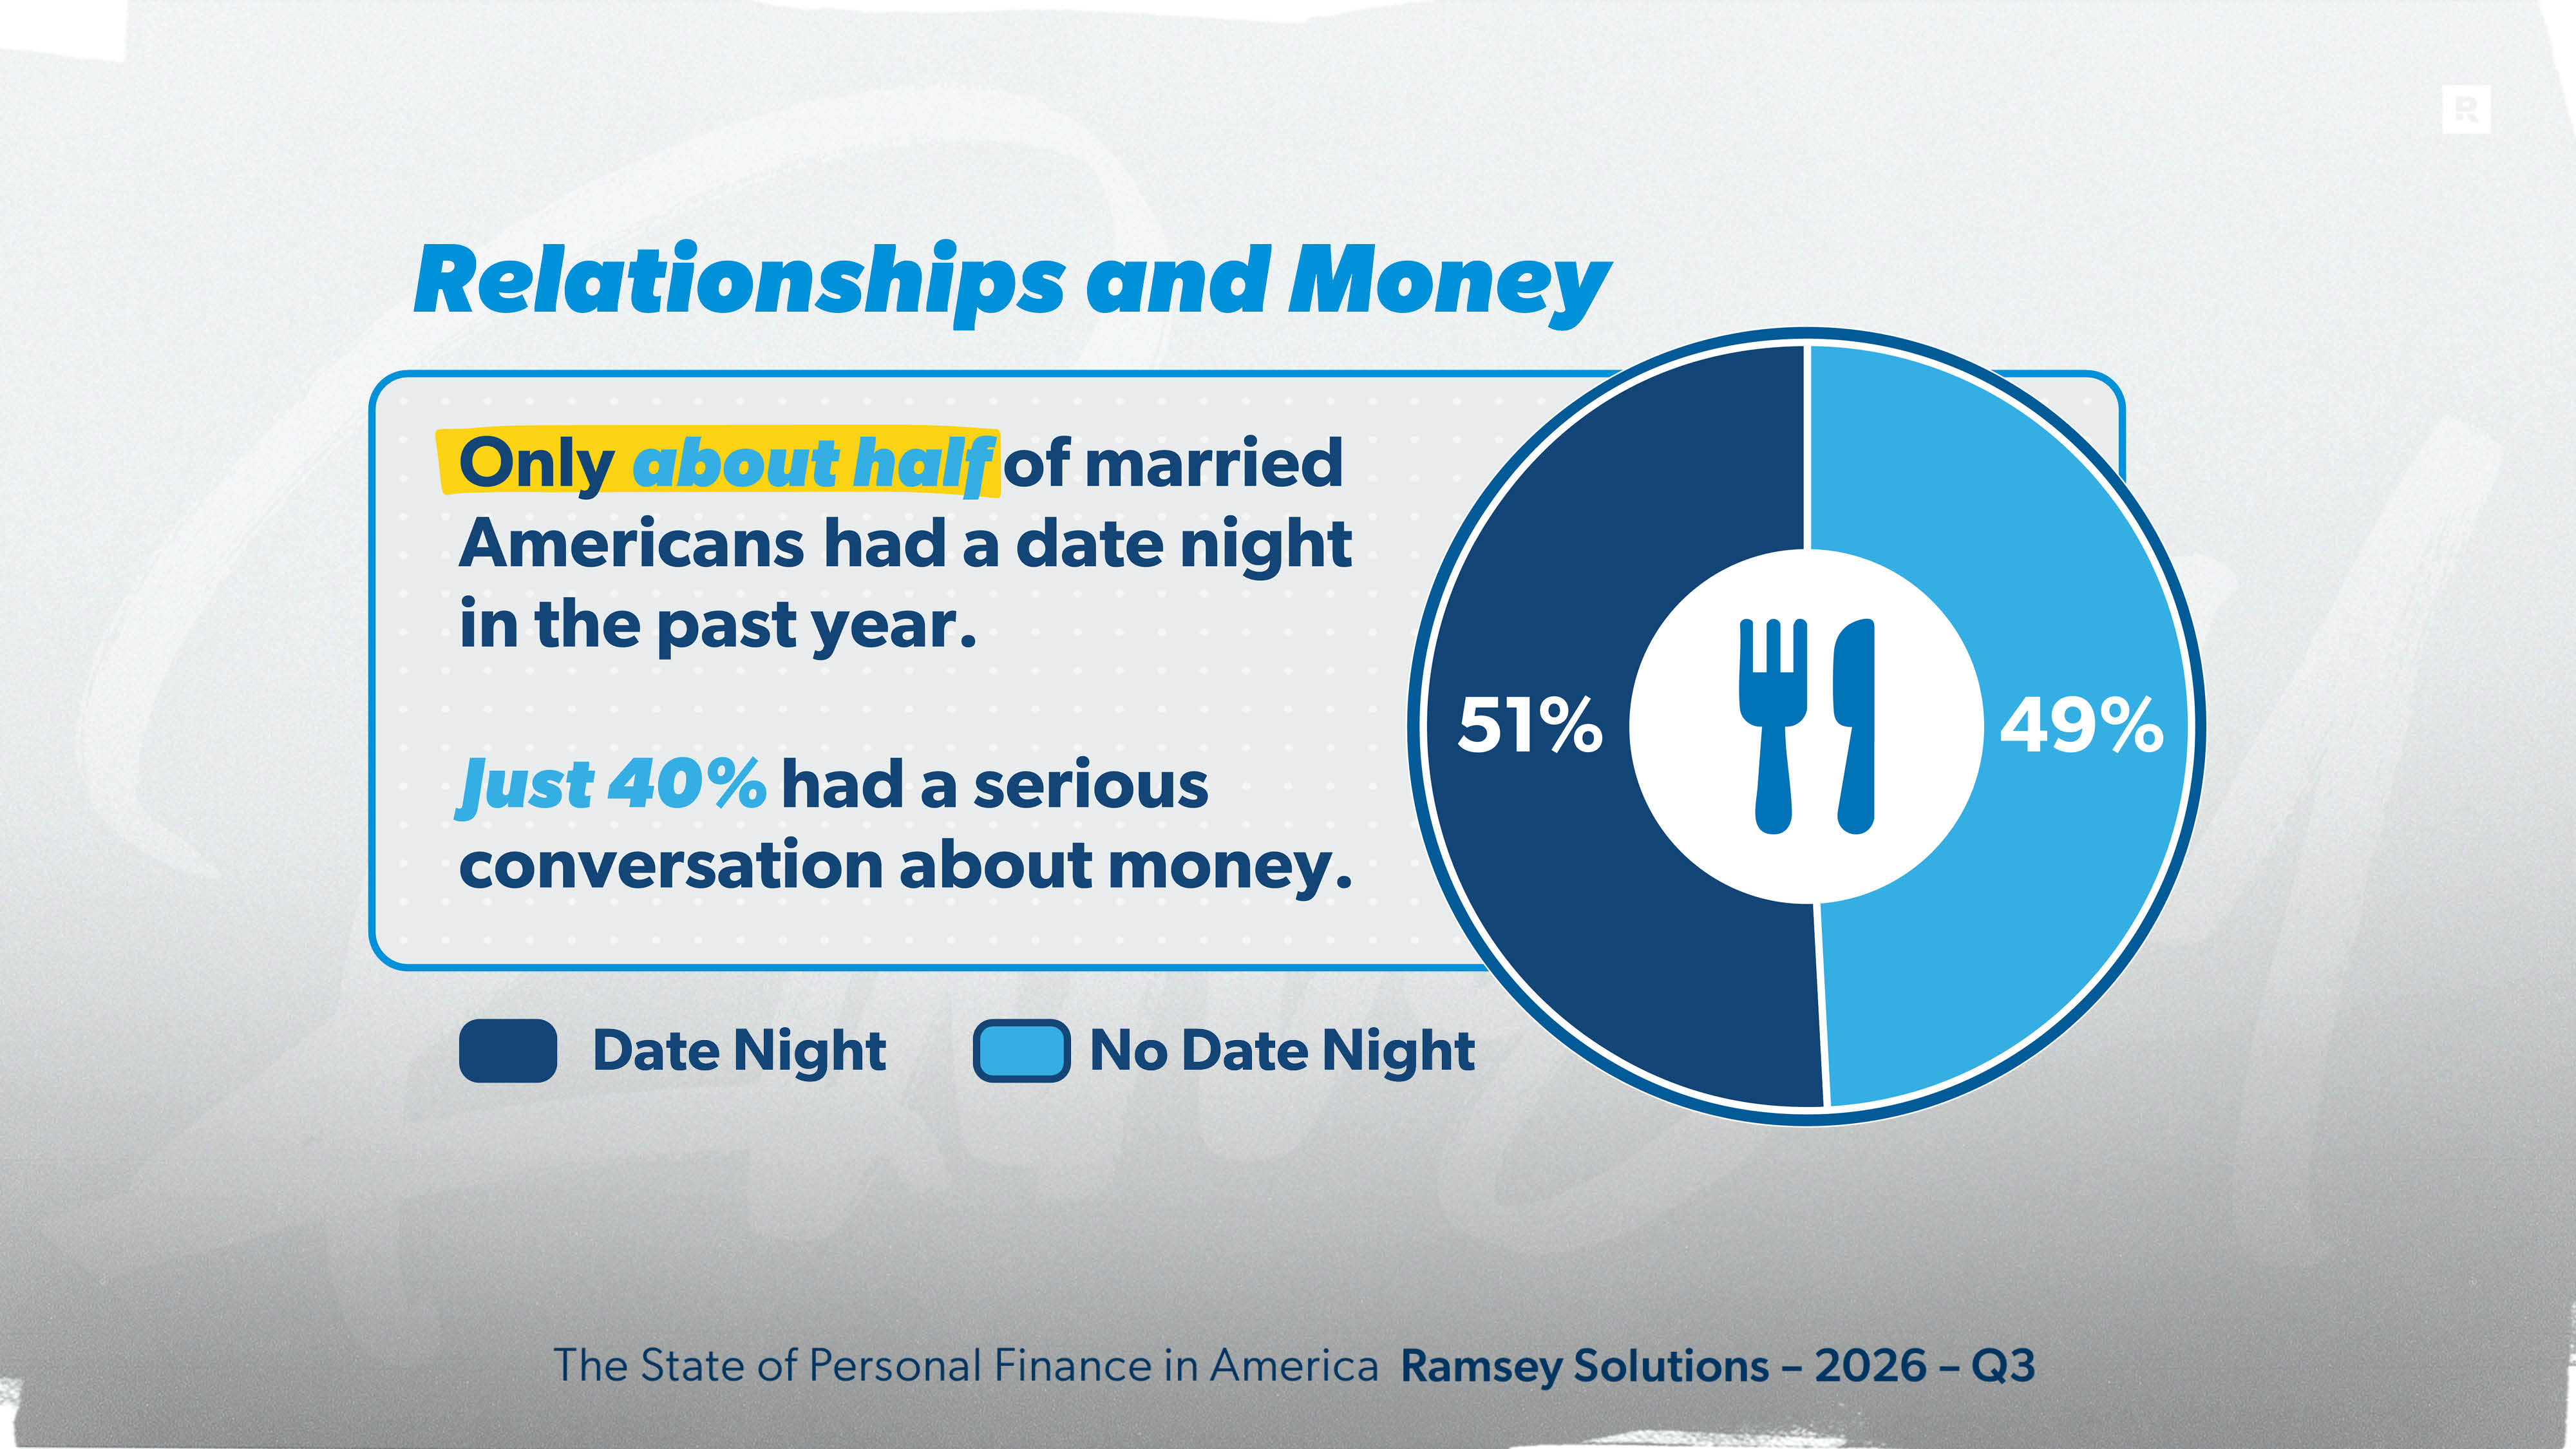
So how much time are couples actually spending on their relationship and their money? Not as much as you’d hope. Only about half of married Americans (49%) have had a date night in the past year, and even fewer (40%) have had a serious conversation about their finances. Just over a third (37%) went on an overnight getaway without the kids, and one-quarter (25%) haven’t done any of these things. However, couples in great marriages are making more time for each other: 61% had a date night in the past year, and 46% took an overnight getaway.
Rethinking the Rulebook: New Paths, New Advisors
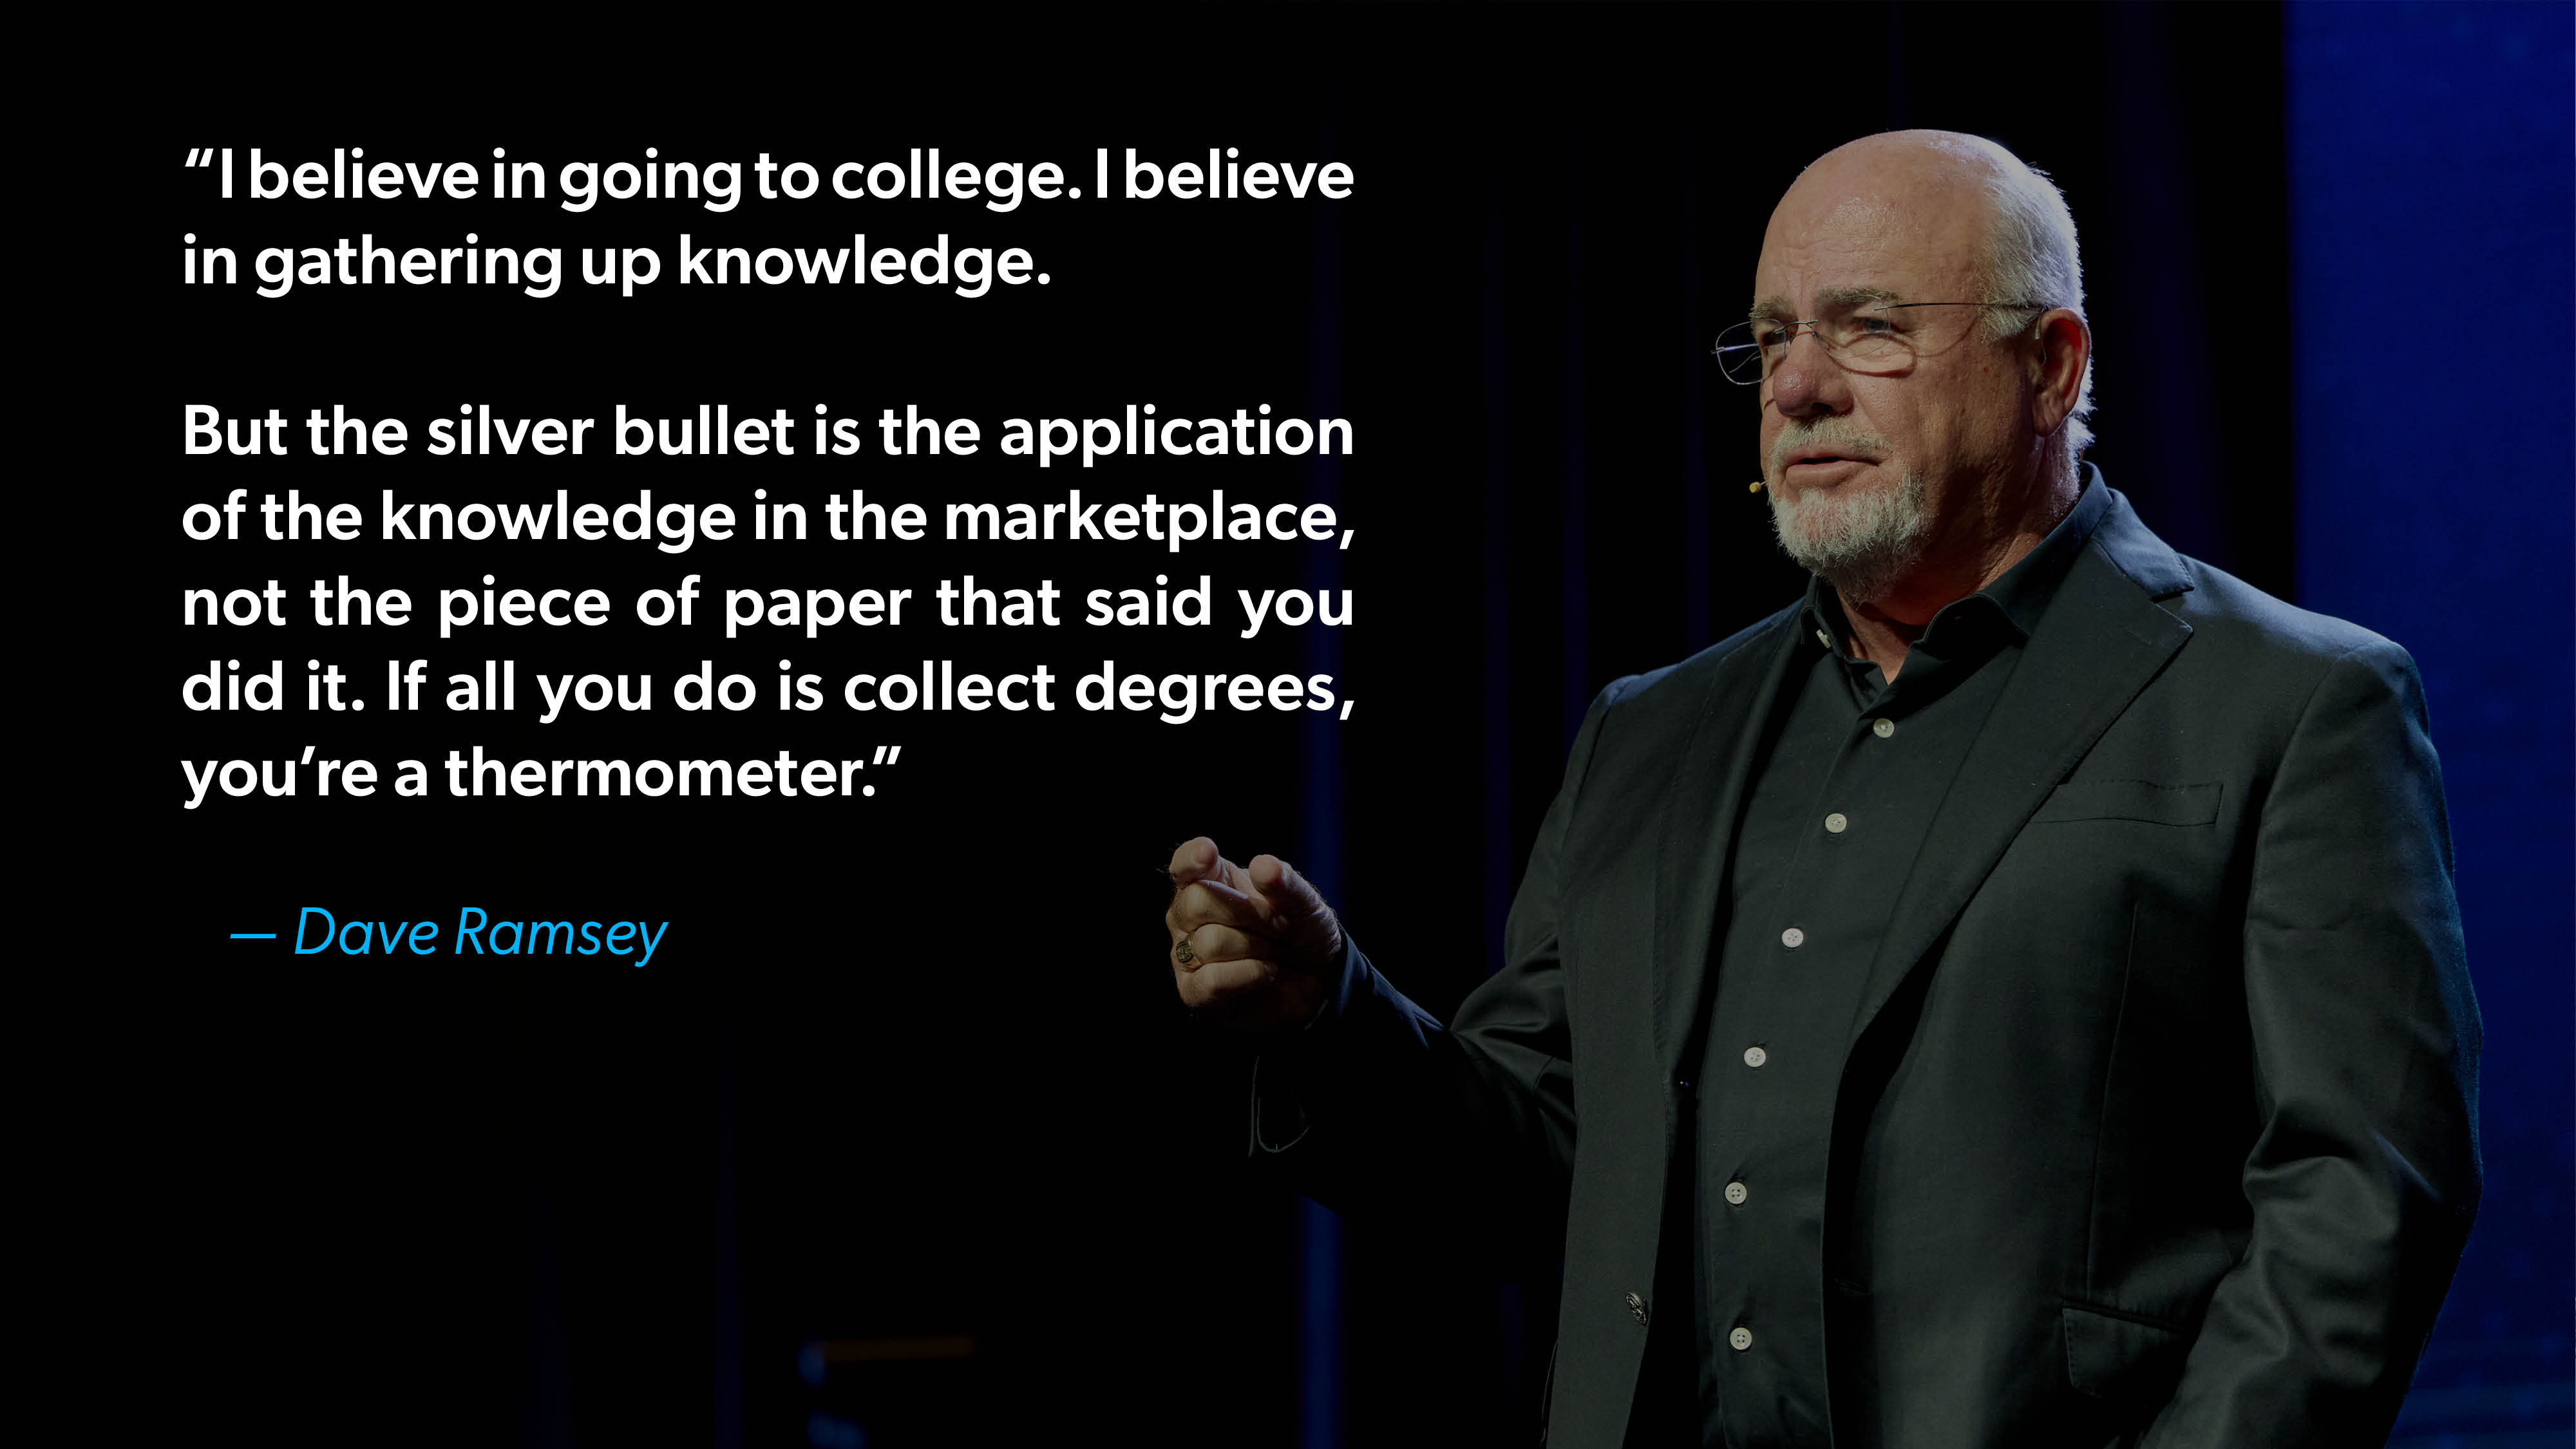
For decades, the path to financial success in America came with a pretty clear set of directions: Go to college, get a degree, land a good job, and work your way up. Parents told their kids. Guidance counselors told their students. It was “the way things are.”
But with the cost of tuition and the potential of student loans weighing on families, Americans are questioning whether the “traditional” path is still the best one.
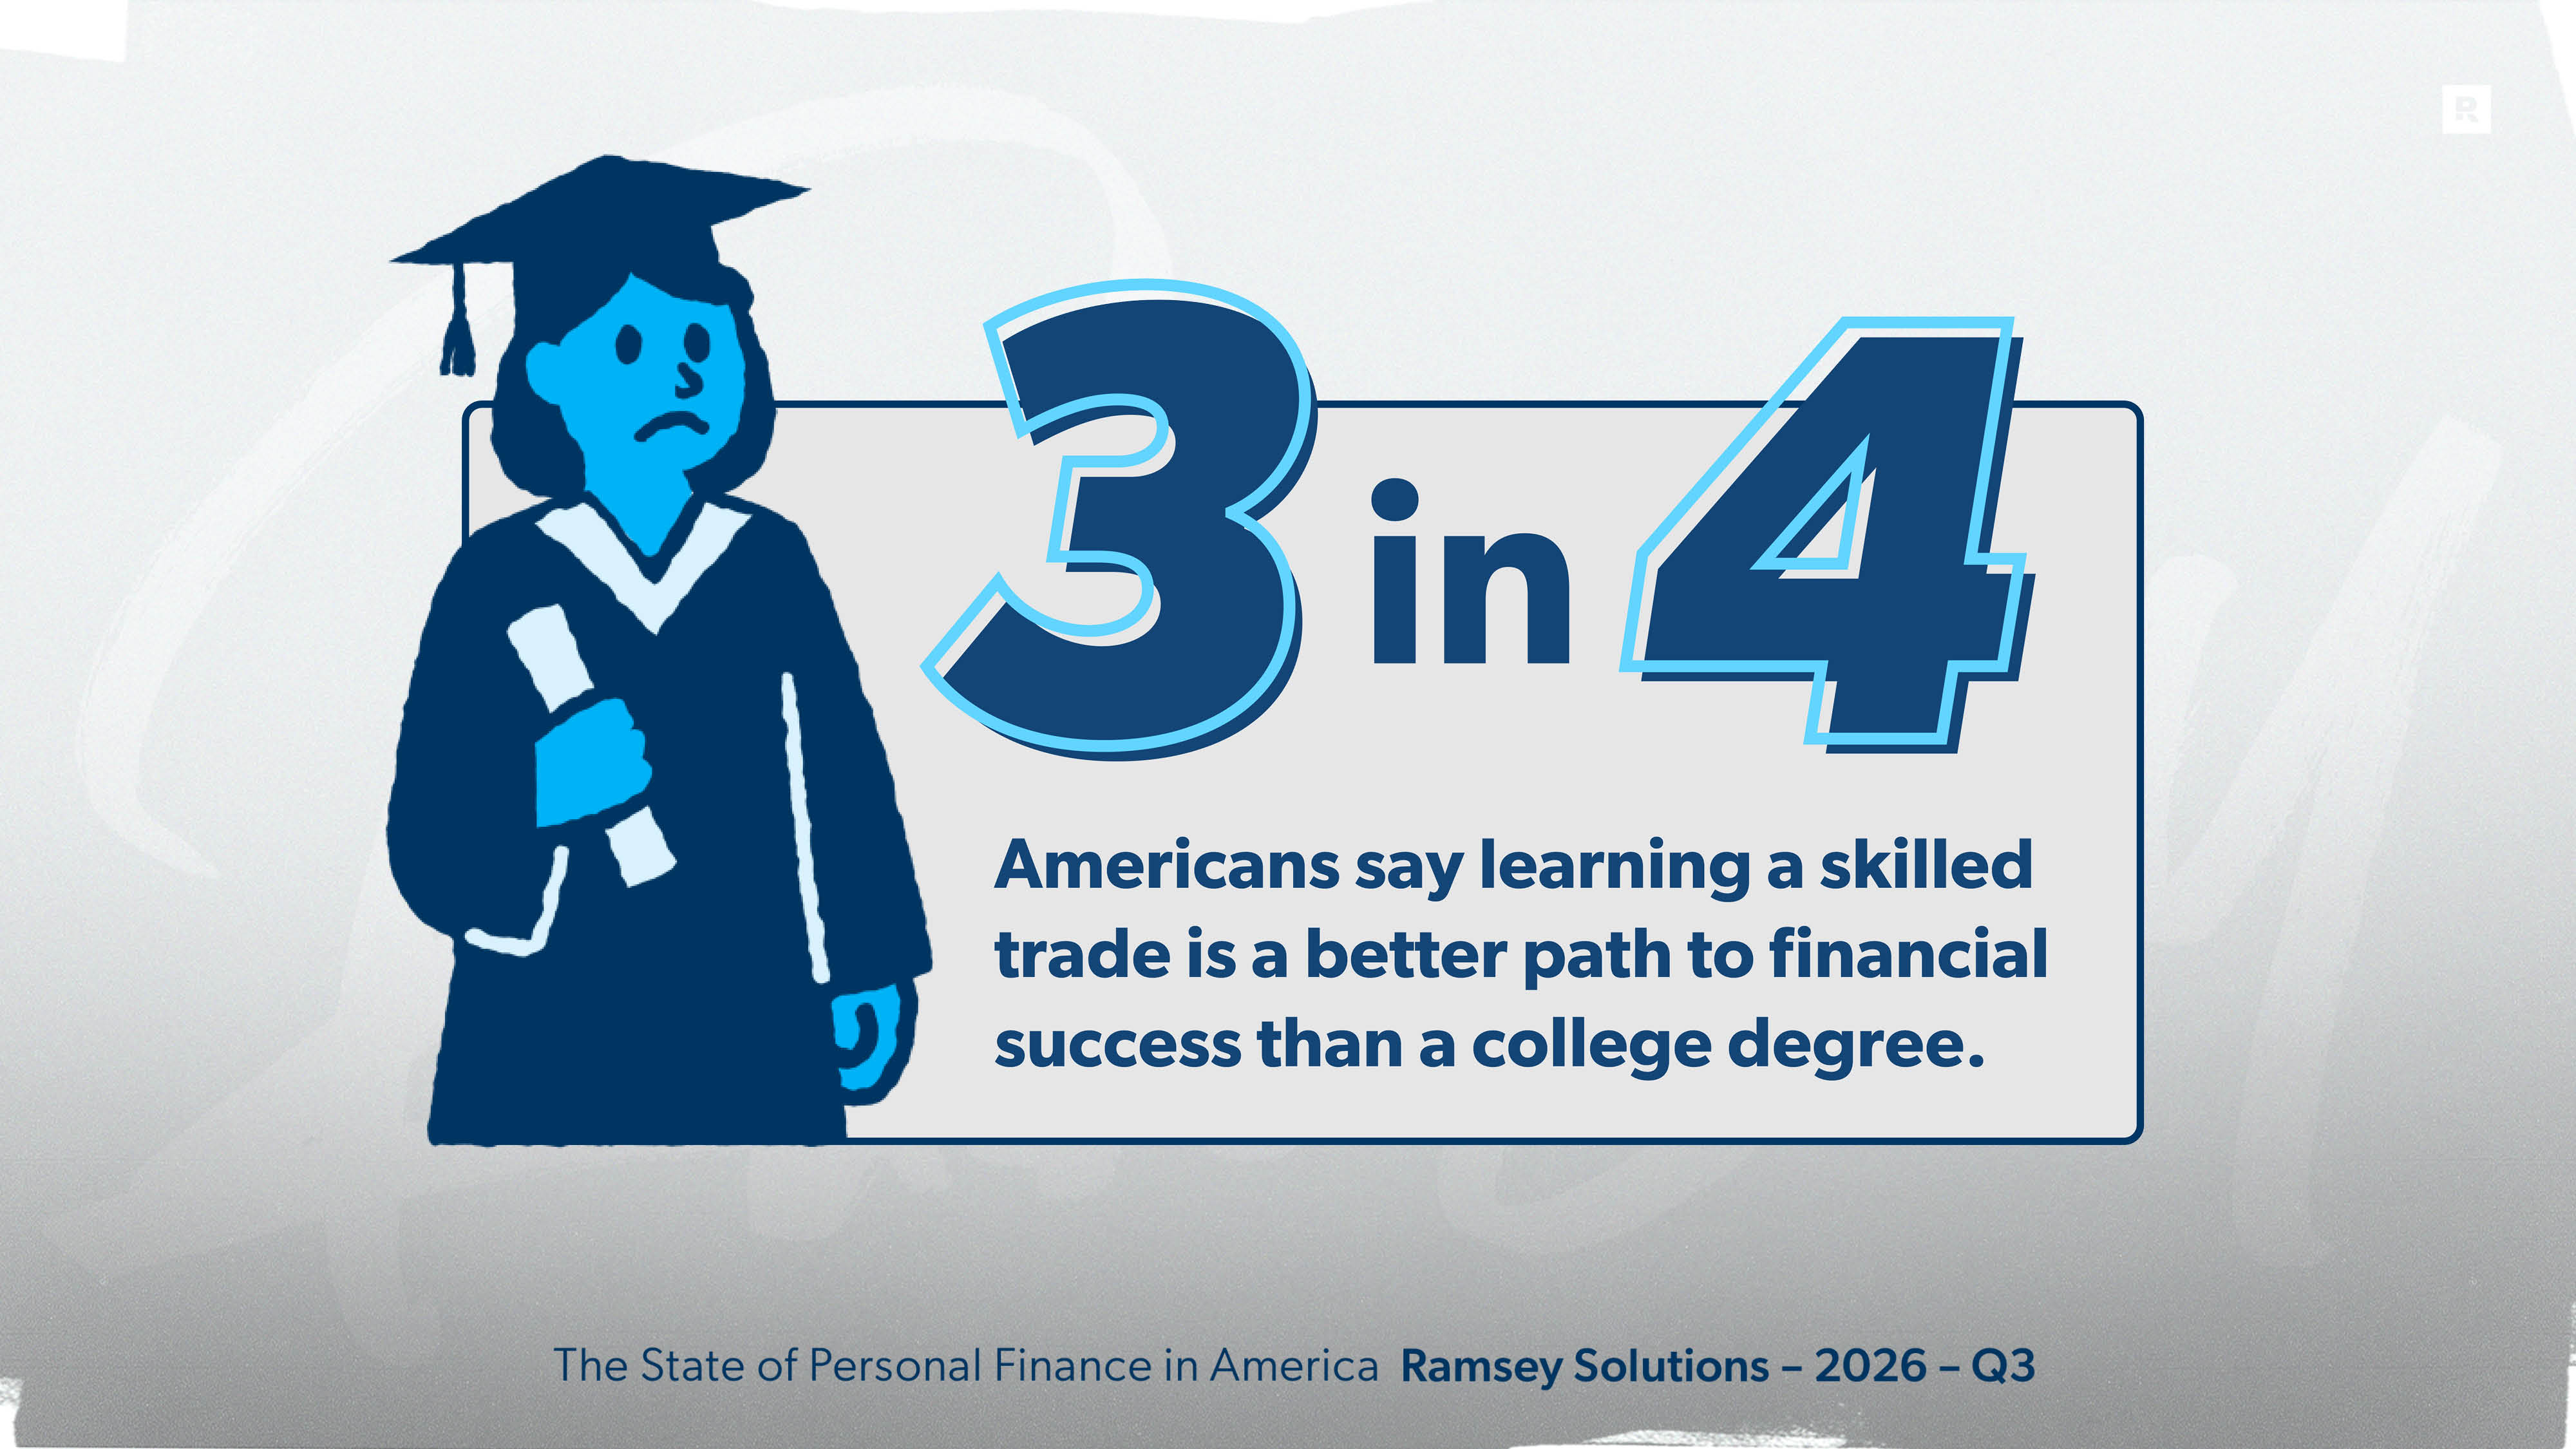
Almost 3 in 4 Americans (72%) say learning a skilled trade is a better path to financial success than a college degree. Women (75% vs. 69% of men) and households earning under $50,000 (76%) are the most likely to agree. Less than half of Americans (44%) say a college degree is necessary to be financially successful today. Even 70% of Americans who have a college degree say a skilled trade is the better path.
Interestingly, younger Americans are the most likely to still see a degree as necessary: 53% of Gen Zers and 48% of millennials, compared to 37% of baby boomers.
That doesn’t mean Americans have written off college. Most (63%) still say the benefits of earning a degree are worth the financial cost, and 81% of degree holders say their own degree was probably or definitely worth it. But that number drops for those with two-year degrees (68%) and those who took out student loans to pay for school (75% vs. 84% of those who didn’t).
Americans Are Turning to AI for Money Advice and More
As trust in the traditional path wavers, Americans are testing new routes to get ahead and new voices to guide them. Not long ago, a question about your health, your money or your job went to a doctor, a friend or maybe a search engine. Now plenty of people are asking AI models like ChatGPT, Google Gemini and Claude.
Four in 10 Americans (43%) have used AI in the past three months to get advice. The most popular topics include physical health (22%), managing money (16%), career (16%), mental health (14%) and relationships (10%). Gen Zers (63%) and millennials (59%) are by far the most likely to have asked AI for advice.
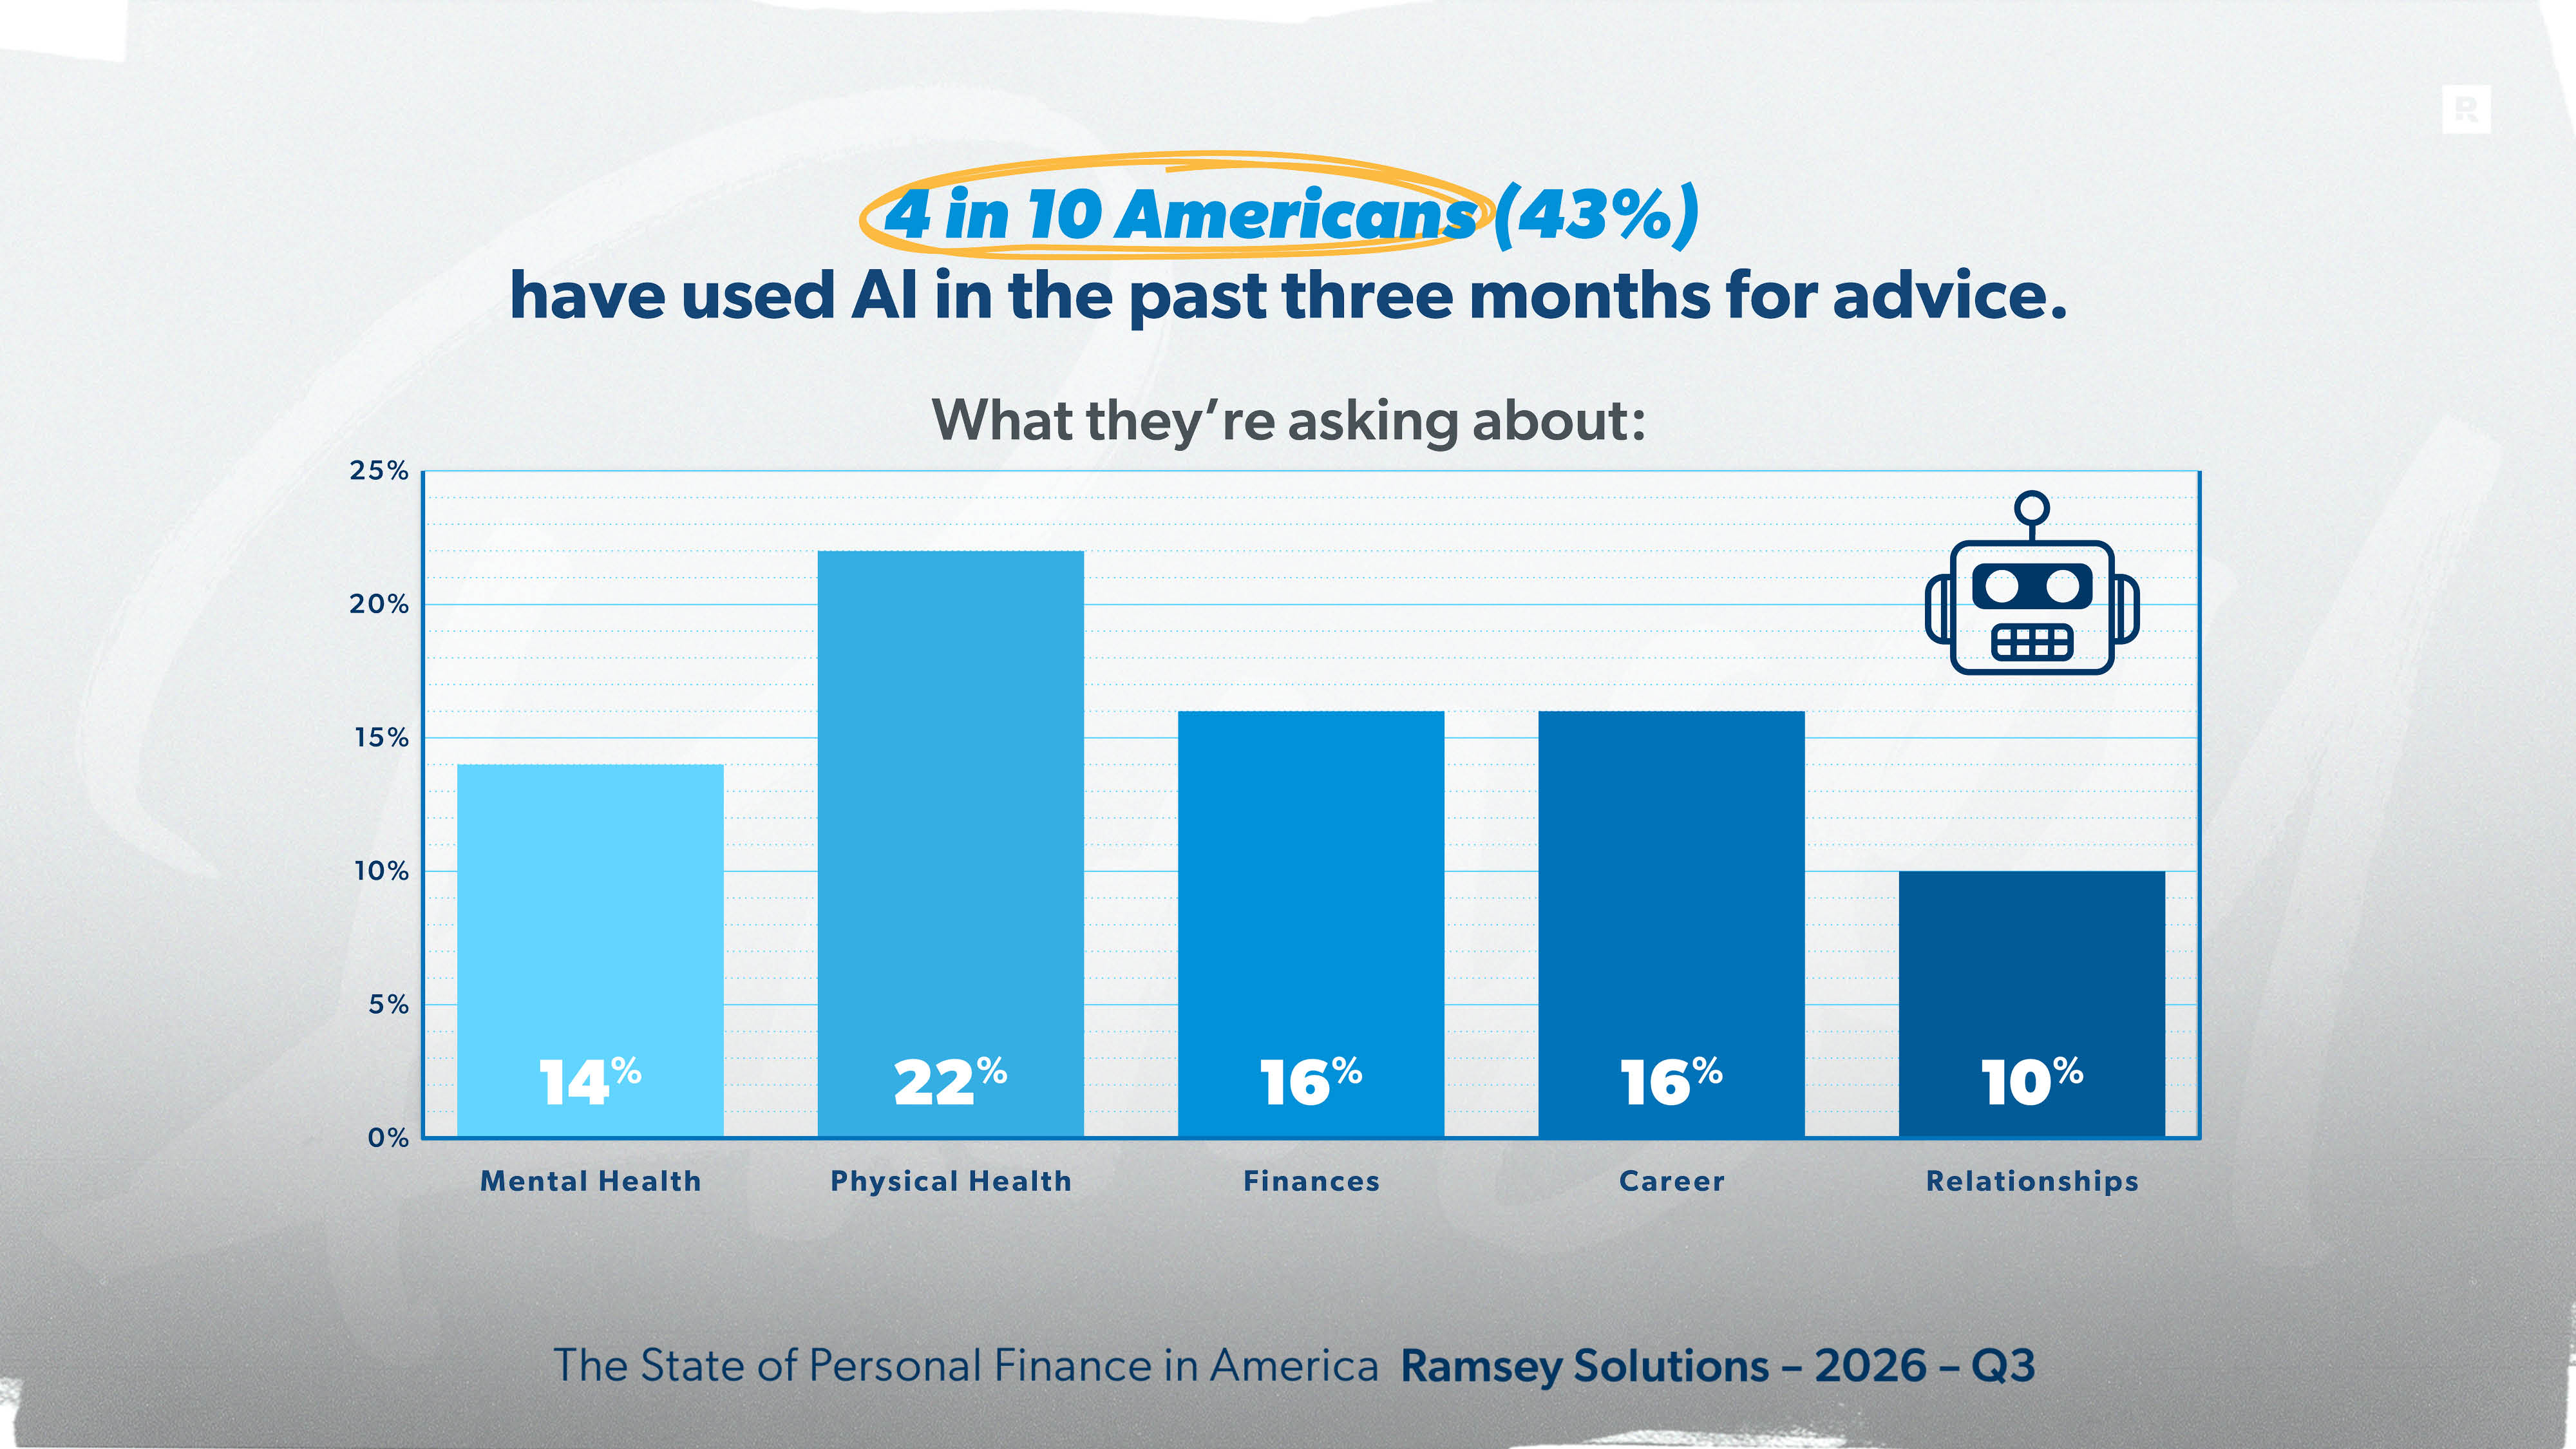
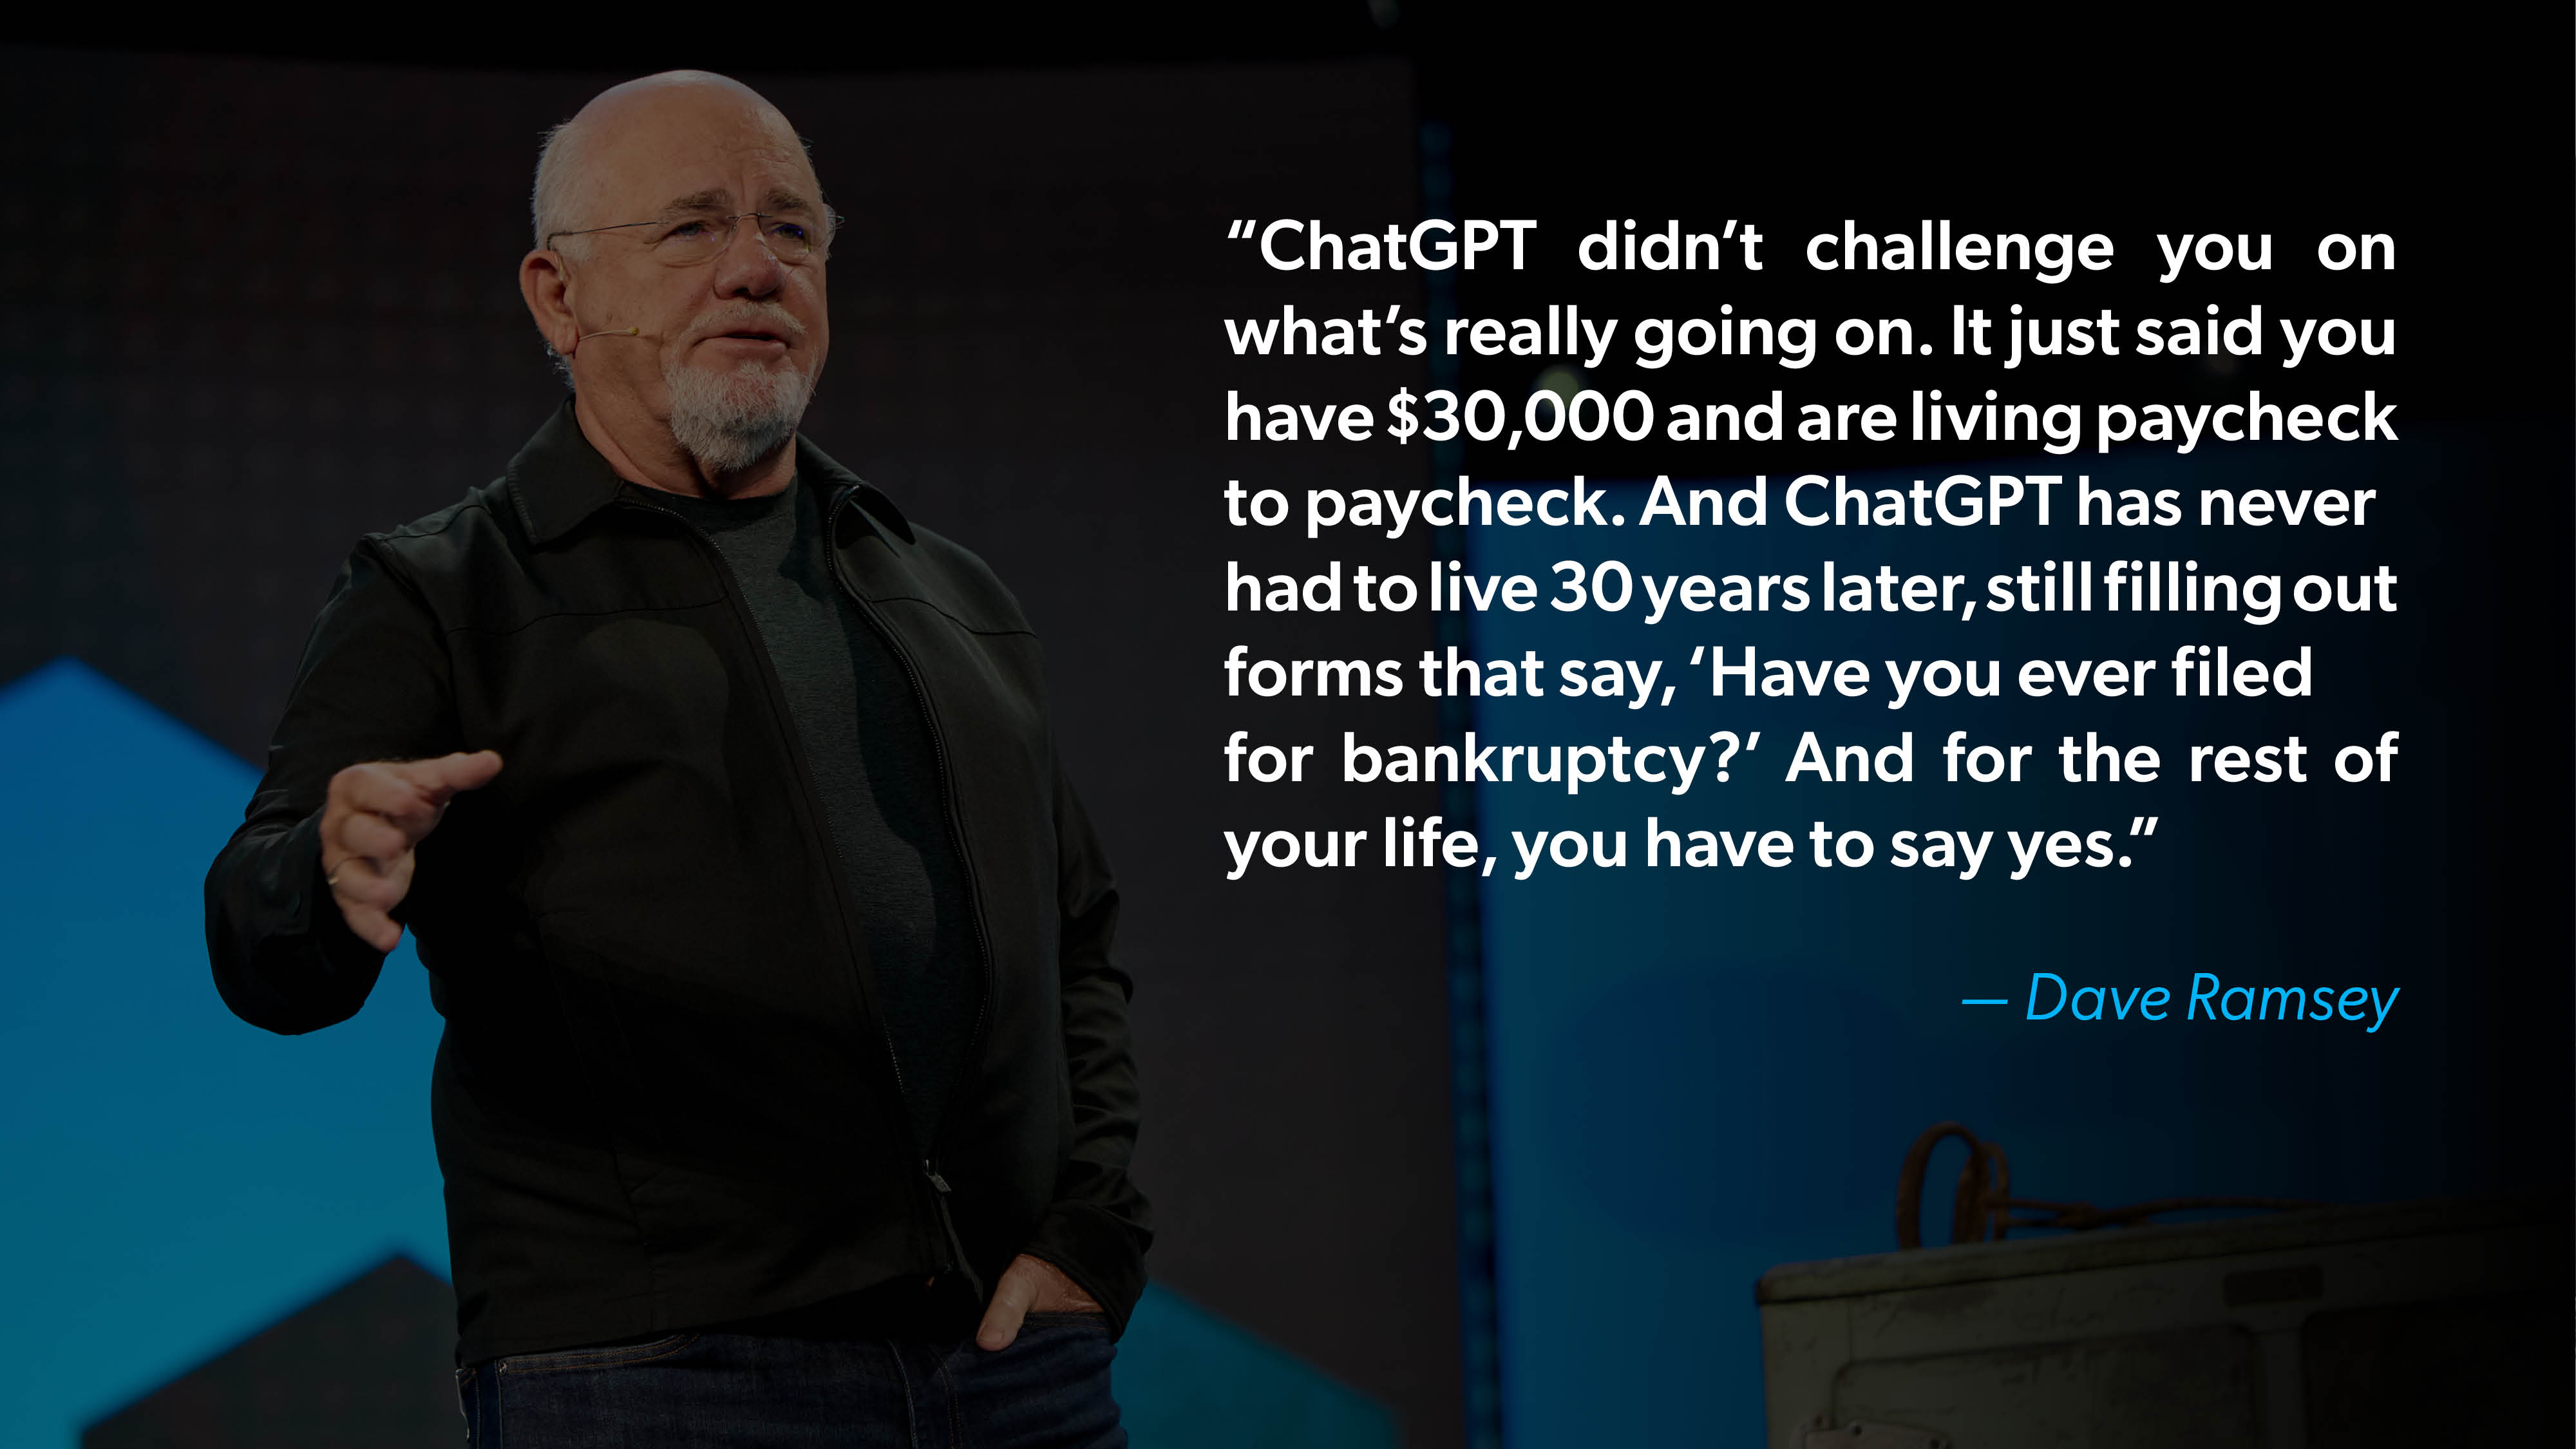
And many aren’t just asking. Over a third of Americans (37%) have taken action based on advice they received from AI in at least one of those areas, including 56% of Gen Zers and 54% of millennials. Twelve percent have acted on AI’s advice about managing their money specifically.
The Cost of the Holidays: Scaling Back Without Skipping Out
The holidays are supposed to be the most wonderful time of the year. For a lot of families, they’re also the most expensive. Gifts, travel, food and decorations can blow up a budget before anyone notices. And the credit card bill that shows up in January is a gift nobody asked for.
With Christmas on the horizon, we asked Americans how they plan to handle the cost this year. The early signs point to a more cautious holiday season.
Half of Americans (53%) say they’re cutting back on Christmas gifts this year because of the cost. Women (59% vs. 47% of men), households earning under $50,000 (72%), and those with consumer debt (62% vs. 38% of debt-free Americans) are the most likely to be cutting back. Close to 6 in 10 of each generation (except baby boomers—34%) are cutting back overall.
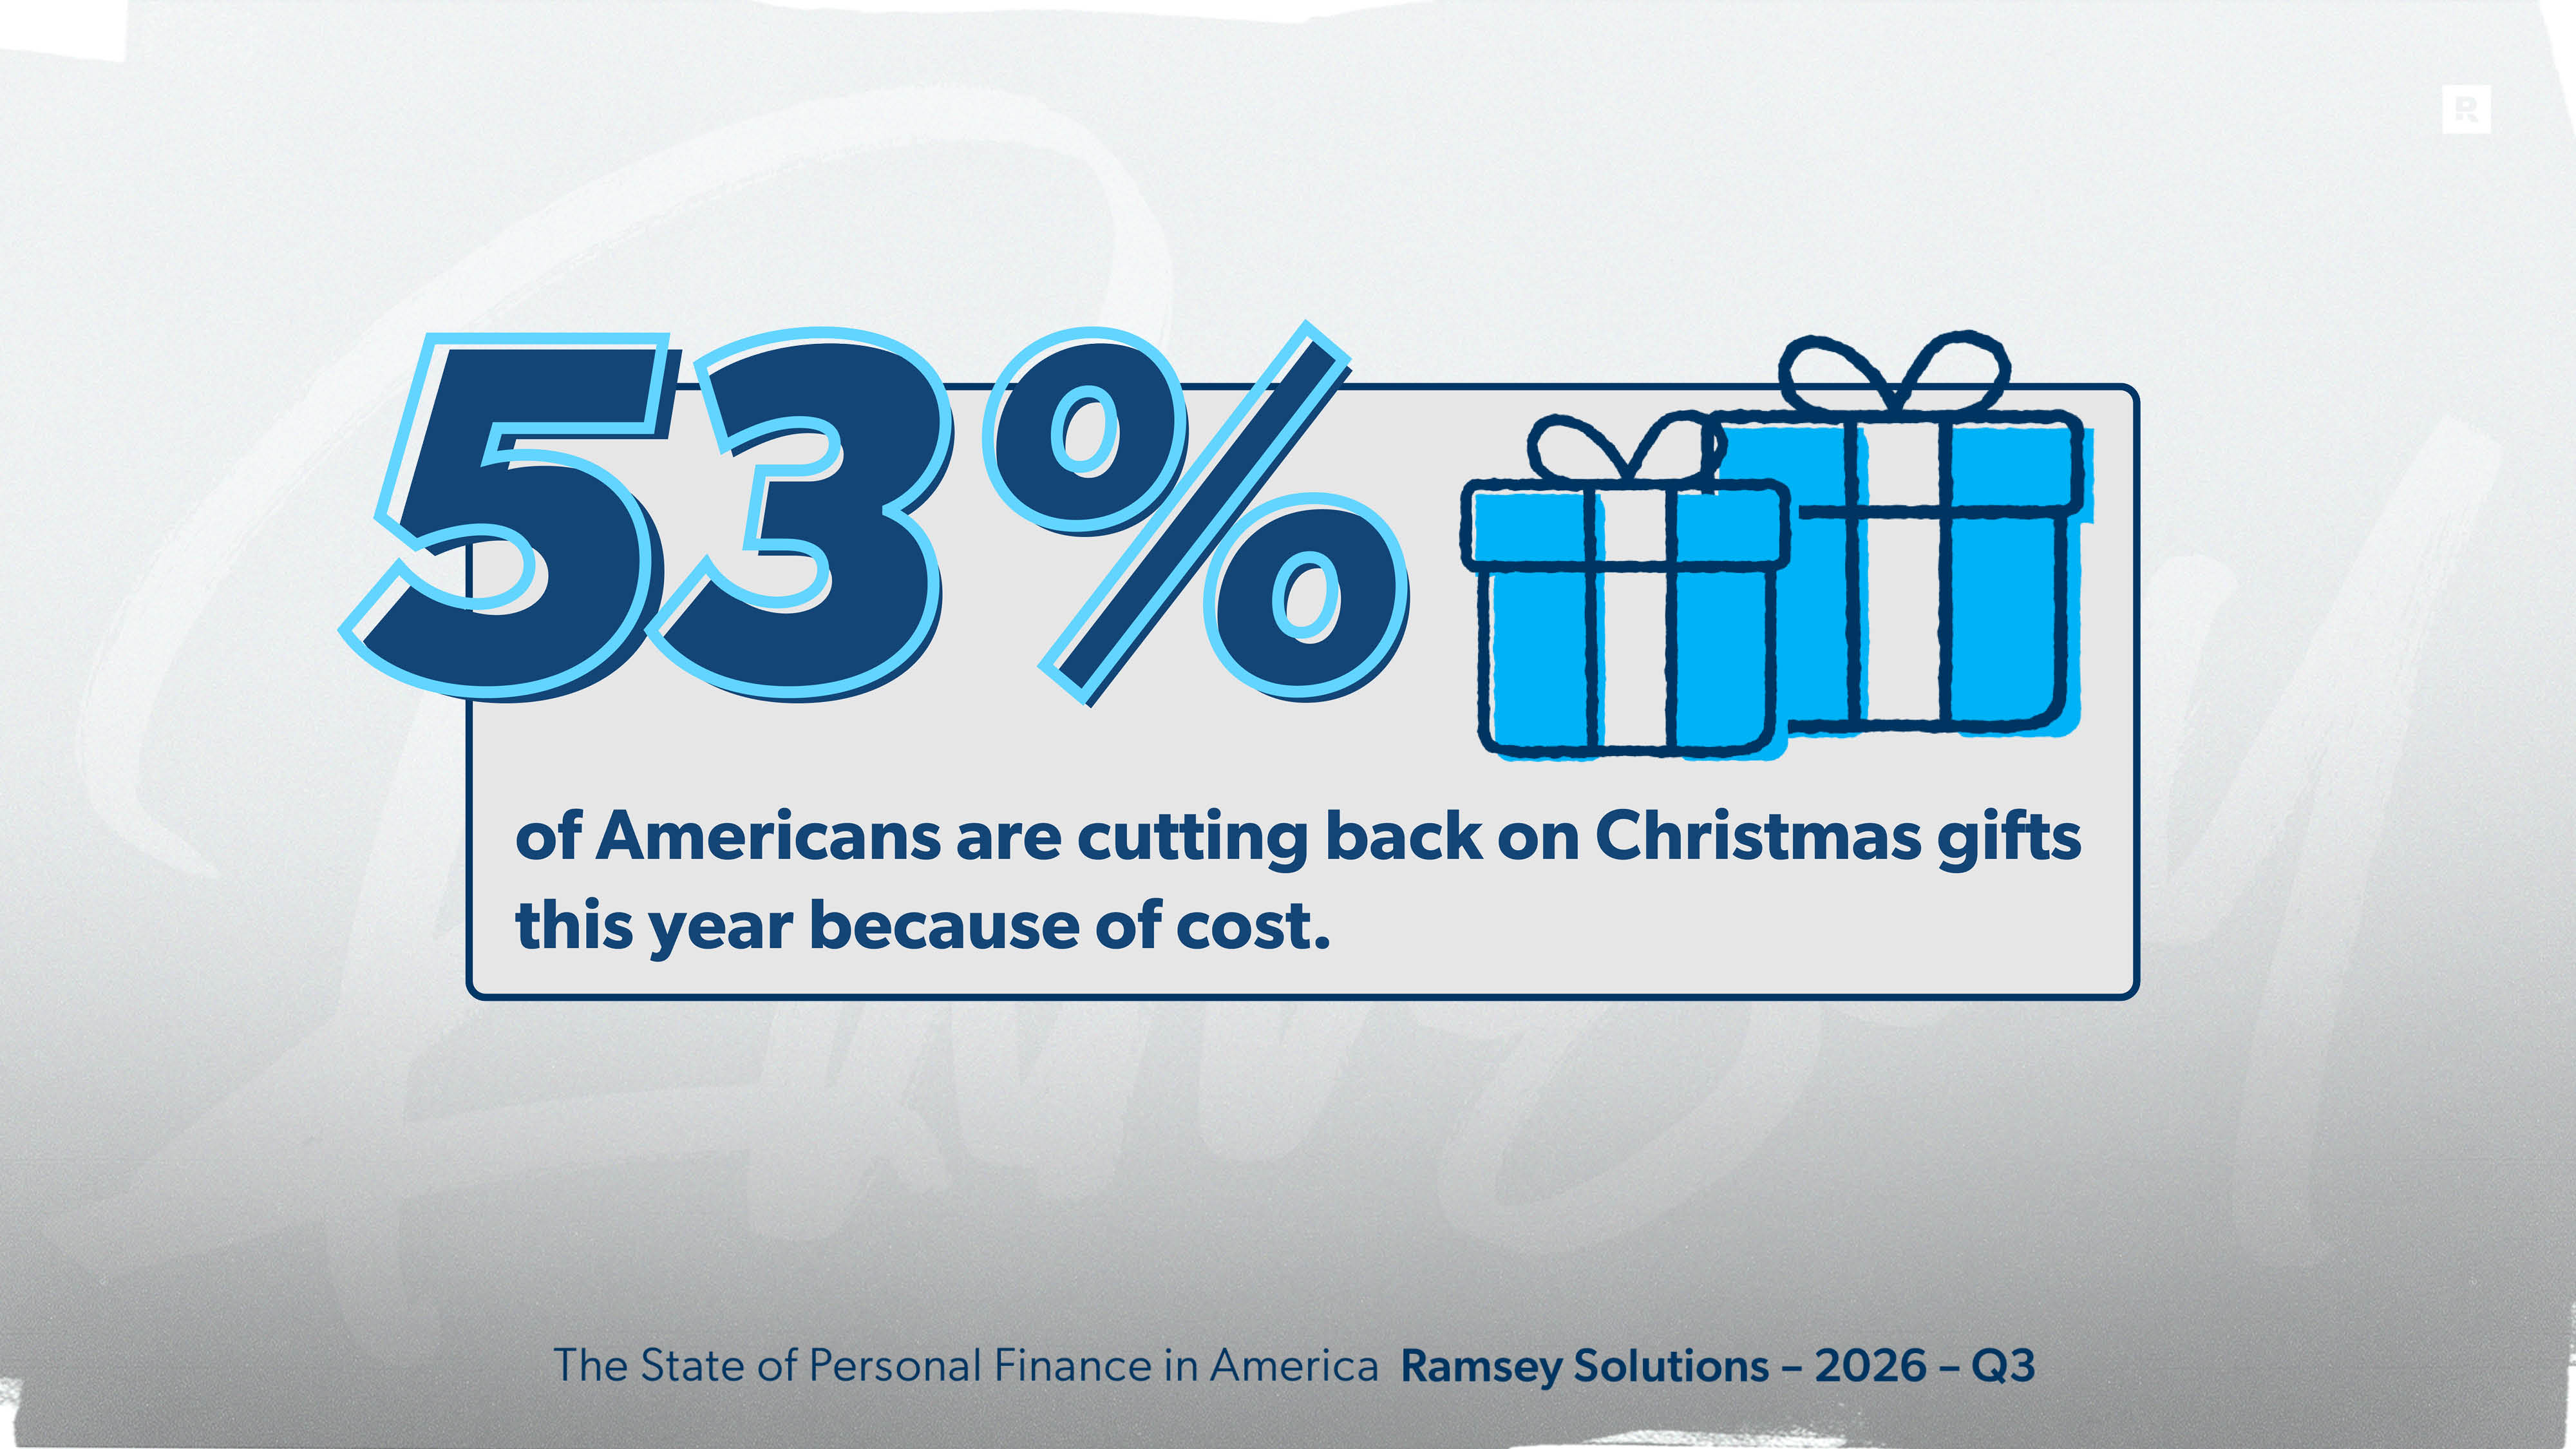
Cutting back doesn’t mean canceling Christmas. Most Americans (74%) still plan to buy gifts this year. Of those, 62% will pay for them as they go, 31% will save up ahead of time, and 7% will put them on a credit card and pay them off over time.
Gen Z is most likely to plan ahead. Half of Gen Zers buying gifts (50%) say they’ll save up for them ahead of time, compared to just 14% of baby boomers. Meanwhile, 81% of boomers plan to pay as they go.
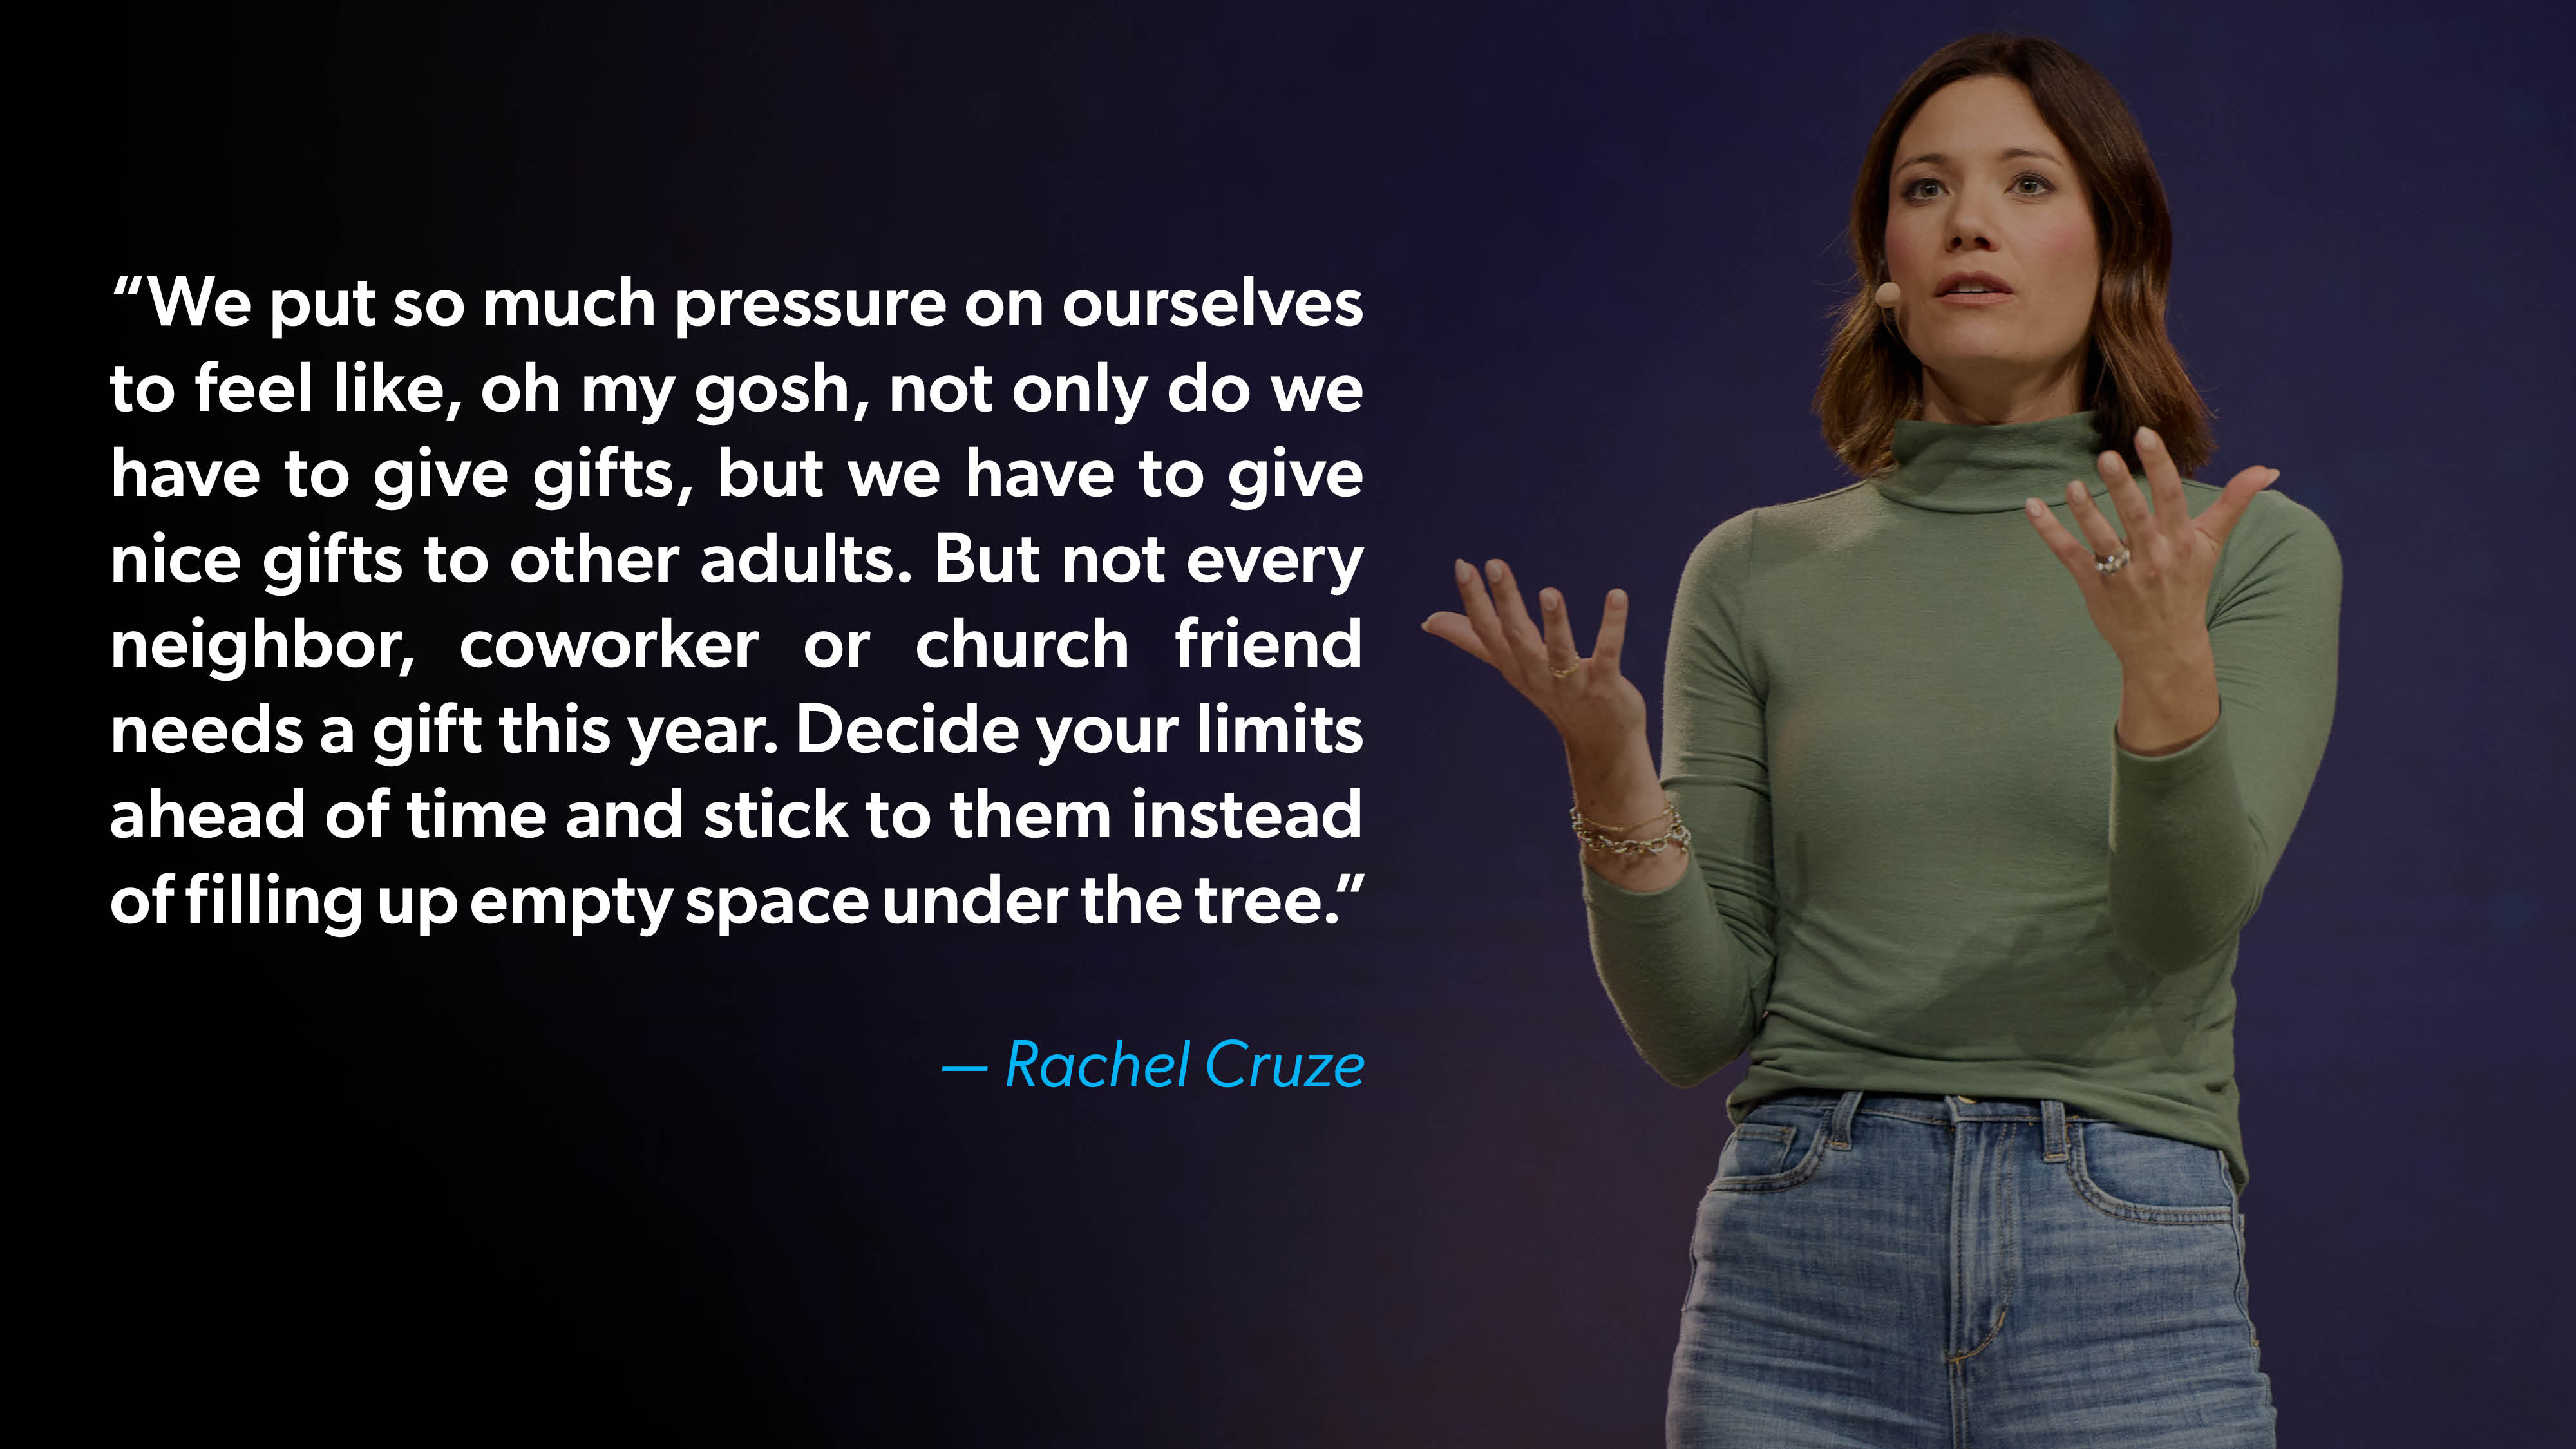
The pressure to make the holidays magical is real. Close to 4 in 10 Americans (37%) feel pressure to create a holiday experience for their family that they can’t really afford. That jumps to over half of Gen Zers (53%) and millennials (51%), compared to 15% of baby boomers. Nearly half of those with consumer debt (46%) feel that pressure, compared to 21% of debt-free Americans.
Americans also are pulling back in how much they travel. One in 3 (34%) say they’ll skip a holiday gathering this year because they can’t afford the travel, including 52% of households earning under $50,000, 46% of Gen Zers and 43% of millennials. And most Americans (57%) say they would rather host a holiday gathering than travel for one, led by Gen Z (64%) and millennials (62%).
Conclusion
This quarter showed how quickly things can change in our world. The financial improvements Americans felt in Q2 didn’t last. Happiness with money dropped, more people are struggling, bills are harder to pay, and daily money worry is back on the rise.
All this uncertainty and stress has put Americans in a paradoxical mentality about who’s in control. They feel like the economy, health care costs and even the holidays are calling the shots. But most still believe the ultimate outcome of their lives is up to them.
Underneath all that stress, though, is a hopeful truth. One of the clearest dividing lines in this study isn’t the economy or the news cycle. It’s debt. Debt-free Americans are far less likely to be struggling or in crisis (20% vs. 44% of those with debt) and far less likely to worry about money every day (30% vs. 65%). And they’re much more likely to say they’re happy with their finances (63% vs. 40%).
That’s where hope is. Hope isn’t sitting in Washington or on Wall Street. It’s in your hands and your behavior. It’s a budget, a plan to pay off debt, and the discipline to build savings. Those choices are available at every income level, not just to the households the economy happens to be kind to.
Americans are showing signs of taking their finances more seriously. They’re cutting back on Christmas gifts and travel instead of swiping the credit card. They are rethinking whether a college degree (and student loans) is the only way forward. And 41% remain optimistic about their financial future, even after a tough quarter.
You can’t control the economy, the price of meat or what your next doctor visit will cost. But you can control your spending. You can work to increase your income. And you can decide today whether you’ll go further into debt or start climbing out of it.
The formula hasn’t changed: Get on a budget, eliminate debt, and build savings. That’s where hope comes from. It starts with a plan—and the decision to start today.
About the Study
The State of Personal Finance in America is a quarterly research study conducted by Ramsey Solutions to gain an understanding of the personal finance behaviors and attitudes of everyday Americans. The nationally representative sample of 1,014 U.S. adults was fielded from August 26 to September 9, 2026, using a third-party research panel. Margin of error was ±3.08%.
Since January of 2021, The State of Personal Finance has surveyed over 20,000 U.S. adults. Data from the study has been shared on over 1,000 media outlets, from Forbes and Fox News Channel to The New York Times and Good Morning America.
Previous Reports
Get Weekly Insights Delivered Straight to Your Inbox
Did you find this article helpful? Share it!

About the author
Ramsey Solutions

Get proven Ramsey answers fast.