
The State of Personal Finance in America Q2 2026
 By
By
Introduction
America is turning 250 years old in 2026! And while fireworks light up the sky and Americans from coast to coast ponder the meaning of independence on July 4, we’re asking Americans how financially independent they actually feel.
The answer is encouraging—at least on the surface. A considerable majority of Americans say they feel financially independent. But what lies beneath that sentiment is a bit more complicated. Debt continues to shackle many Americans. Gas prices are squeezing household budgets. And Gen Zers, who are just getting started in a difficult economy, are entering a financial world that older generations agree is harder than what they faced.
Despite being an aspiration of most Americans, true financial independence seems impossible for many. And yet, Americans are responding with hope and action. Millions are making smarter daily decisions that are adding up to some significant behavior changes.
This edition of The State of Personal Finance examines financial independence across America: what it means, what’s challenging to independence, and what everyday Americans are doing to actually get there.
Executive Summary
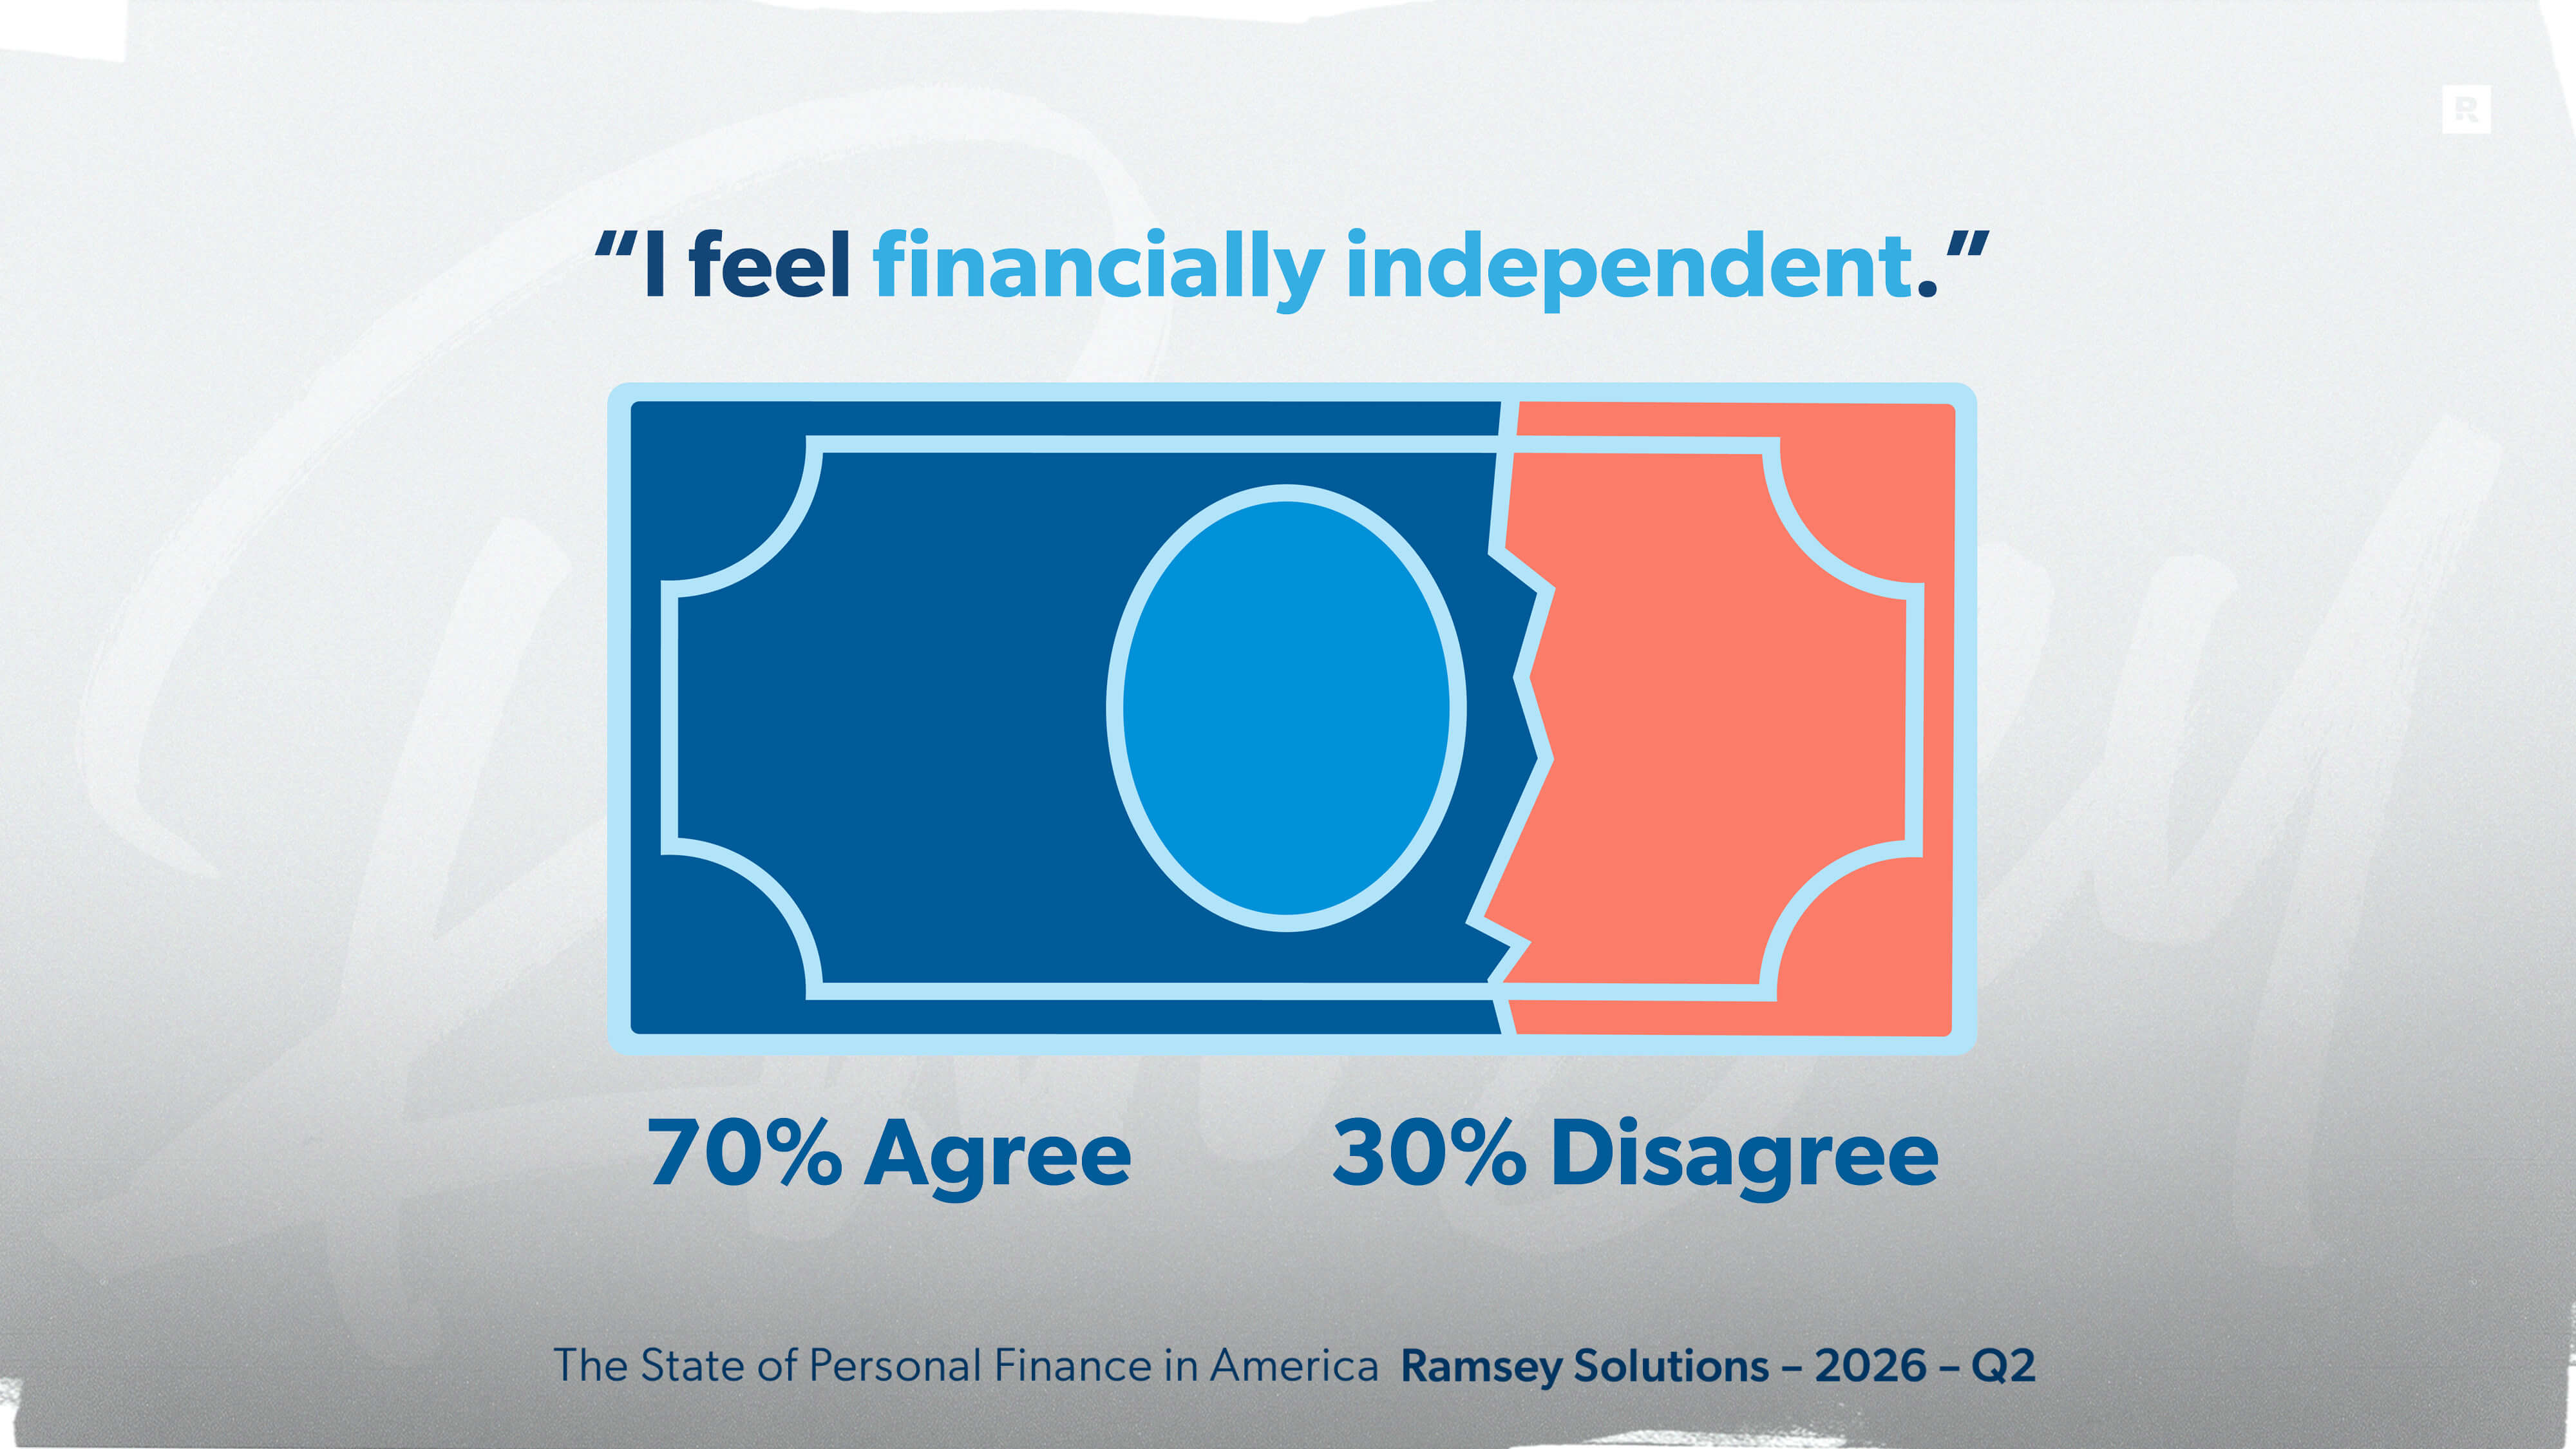
- More than two-thirds of Americans (70%) say they feel financially independent.
- When asked whether they would rather have a stable job with a regular paycheck or run their own business, 68% of U.S. adults chose job security.
- More than half of Americans (58%) say the conflict between the U.S. and Iran is hurting their personal finances, and 44% say they are spending less because of the financial uncertainty it has created.
- 6 in 10 U.S. adults (59%) say they are driving less because of rising gas prices.
- The national median price at which Americans would say that gas is getting cheaper is $3.10 per gallon.
- One-quarter of Americans (24%, or about 62 million people) say they worry about their debt every single day.
- About one-third of U.S. adults (36%) say Gen Z faces the toughest financial road—more than any other generation.
- When Americans were asked which milestones feel more financially impossible today than for previous generations, the top answer was living on one income (31%). Homeownership came in second at 25%.
- When asked about resolving fraud, the difference between credit and debit card users is negligible. Seventy-one percent of U.S. credit card users say the resolution process was “easy” or “very easy,” and 66% of U.S. debit card users say the same.
- Just over one-third of married Americans (37%) say they “feel more like roommates than romantic partners.”
Download a PDF version of this report.
Download a full electronic press kit (EPK)
of the report, including full-size graphics.
Financial Independence: A Mixed Picture
As the country marks its 250th year, 70% of Americans say they feel financially independent. That’s a sizable majority, and a surprising result given the social and economic turmoil of recent years.
Now, financial independence doesn’t mean the same thing to everyone. For some, it’s simply having a stable income that covers the bills. For others, it’s being in a place where one bad month (or several) wouldn’t cause a financial disaster. And this study reveals that these definitions are often shaped by a person’s debt, income and age.
Debt has the biggest impact on feeling financially independent. After all, the borrower is slave to the lender (Proverbs 22:7), which is the opposite of independence. Of Americans who are debt-free, 80% say they feel financially
independent, but for those who carry consumer debt, that number falls to 63%—a 17-point gap that holds across every demographic measured.
Income affects the picture just as sharply. Among Americans earning over $100,000 a year, 83% say they feel financially independent. For those earning under $50,000 annually, it drops to 51%.
Baby boomers, who have had decades to build wealth and pay off debt, are the most likely generation to say they feel financially independent (76%). Gen Z, just entering the workforce and often weighed down by student debt and a difficult housing market, is the least likely (63%).
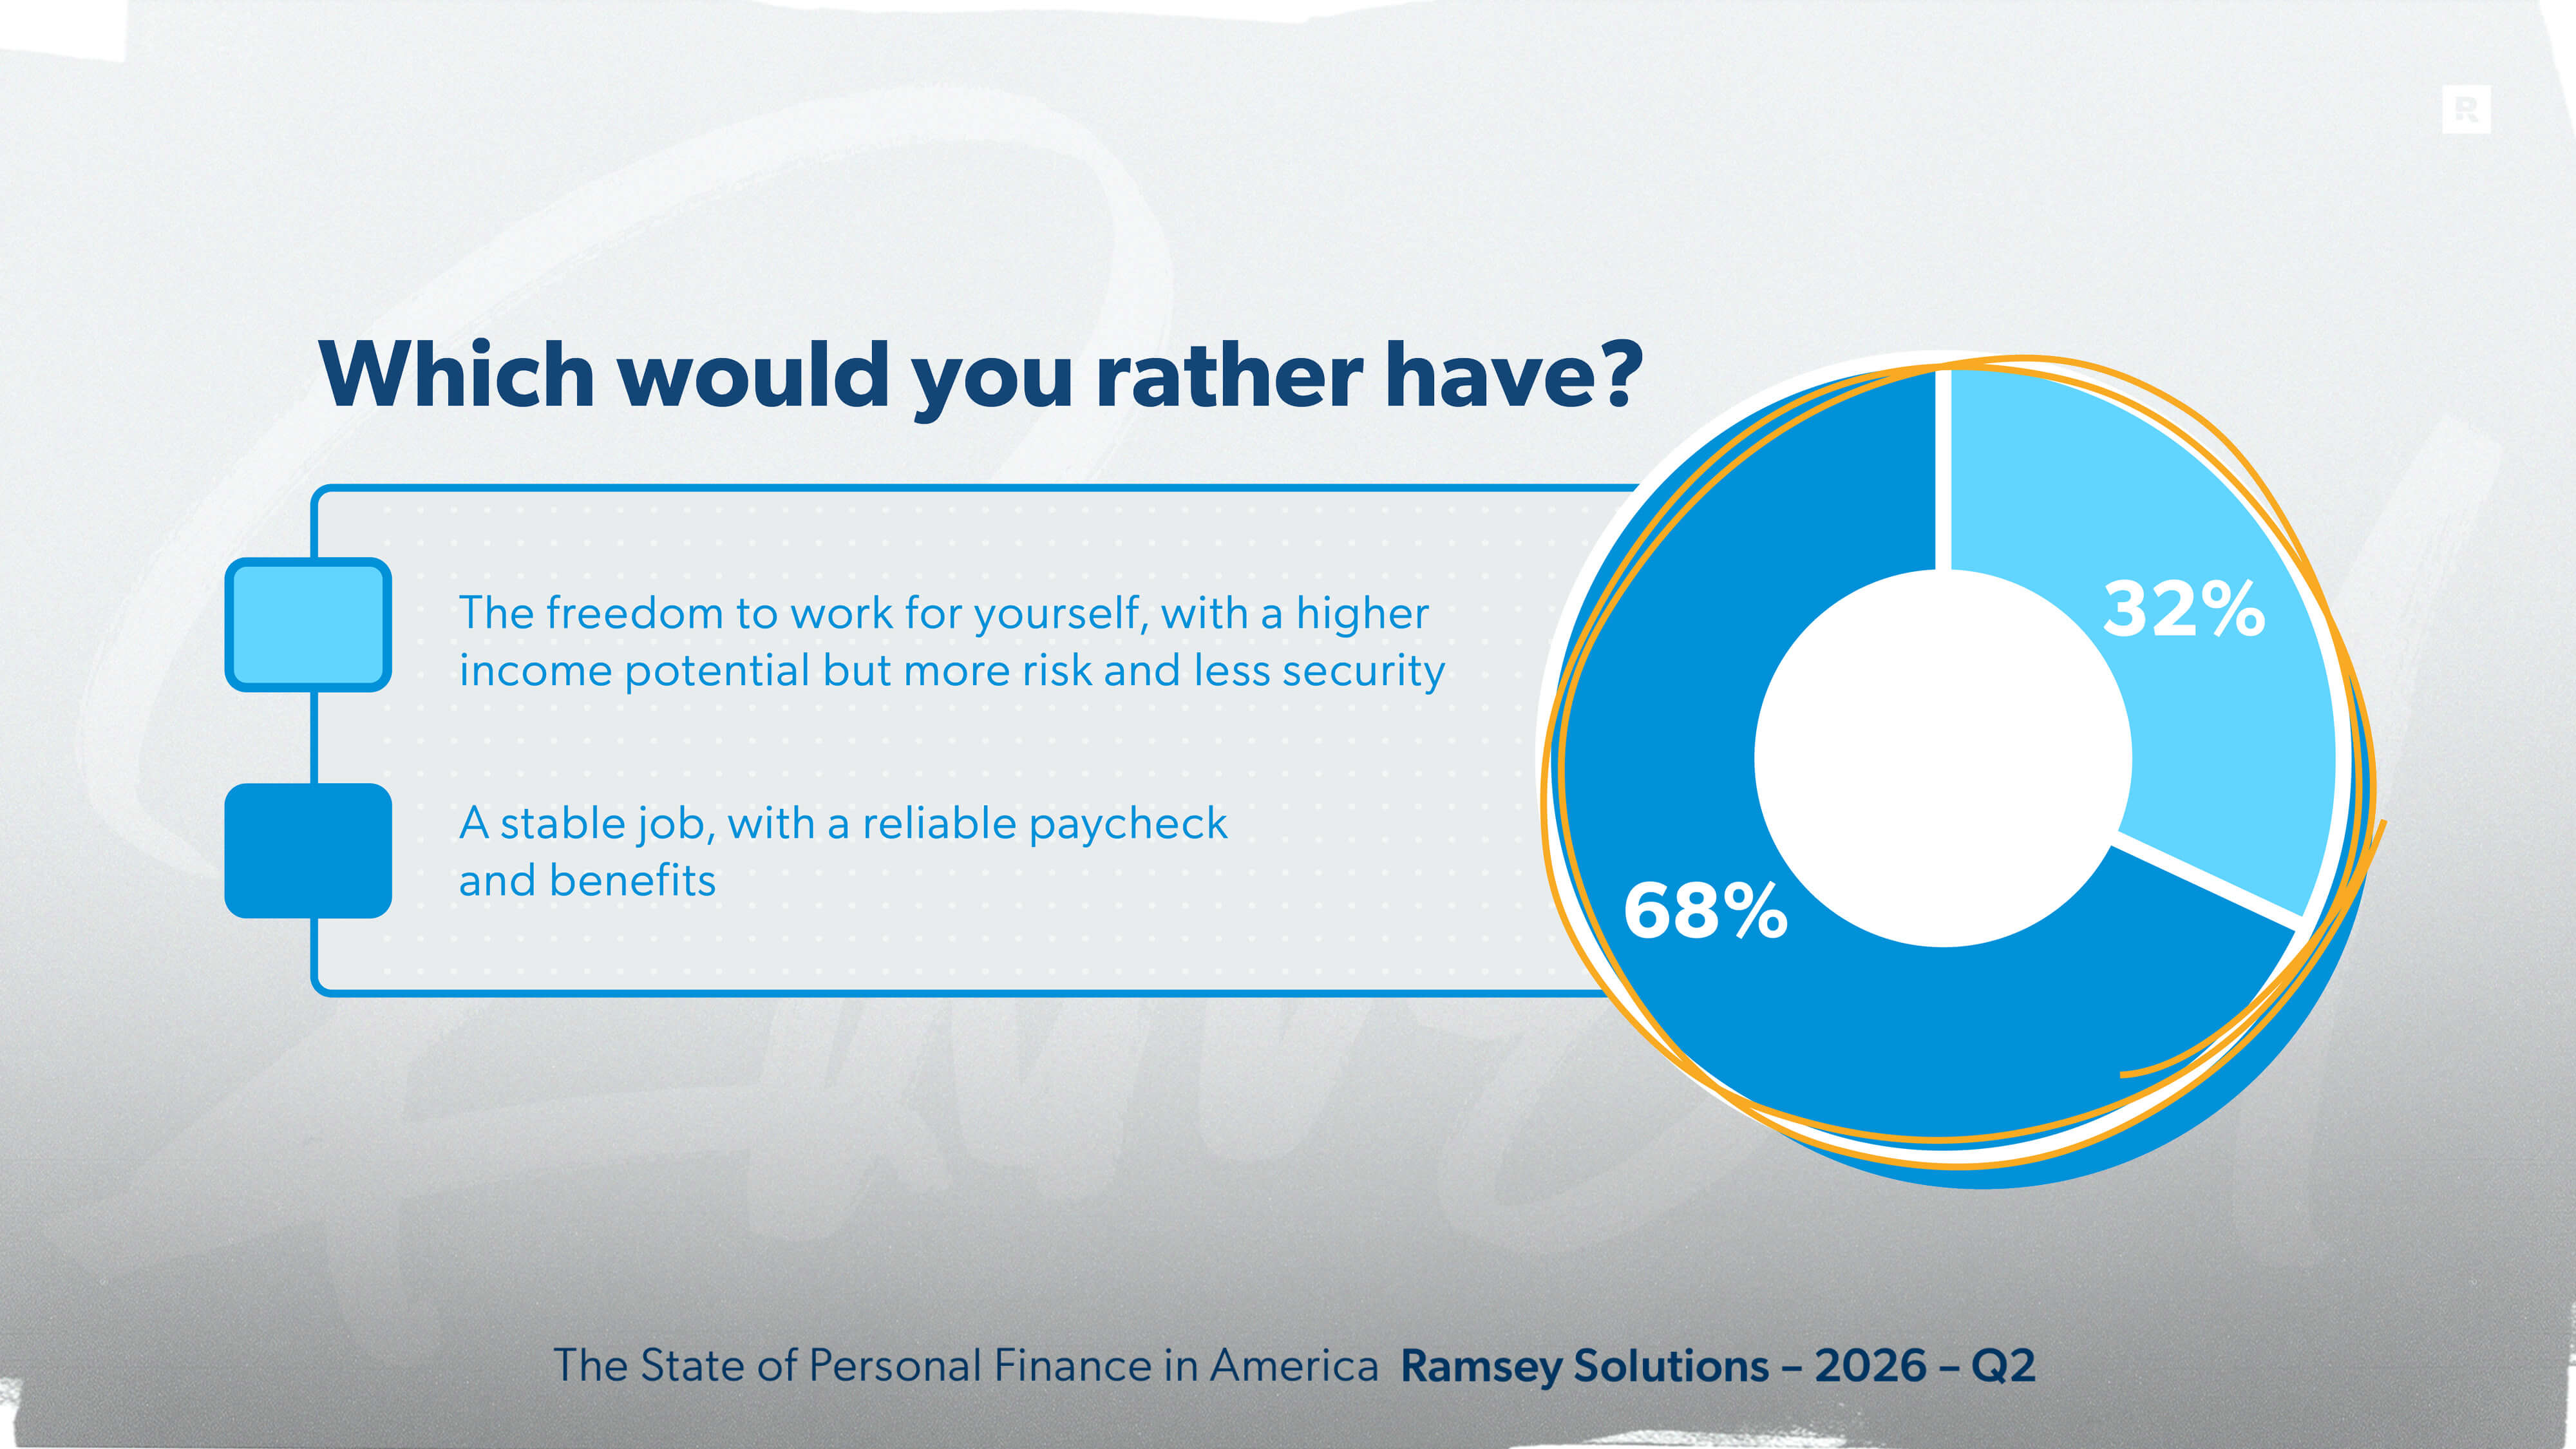
For most Americans, financial independence doesn’t mean going it alone. When asked whether they would rather have a stable job with a regular paycheck or run their own business, 68% of Americans chose job security.
But many millennials and Gen Zers don’t agree with that sentiment. Nearly 4 in 10 of both generations (38%) would rather be their own boss, compared to only about 27–29% of older generations. The younger you are, the more likely you are to see entrepreneurship, not traditional employment, as the path to financial independence.
Global Tensions Are Hitting American Wallets
Americans crave stability. When events at home and abroad shake that foundation, it changes how they handle their money—or at least how they feel about the financial climate. The current conflict between the U.S. and Iran has caused financial uncertainty for many Americans, as more than half (58%) say the conflict is hurting their personal finances. And 44% say they are spending less because of the conflict.
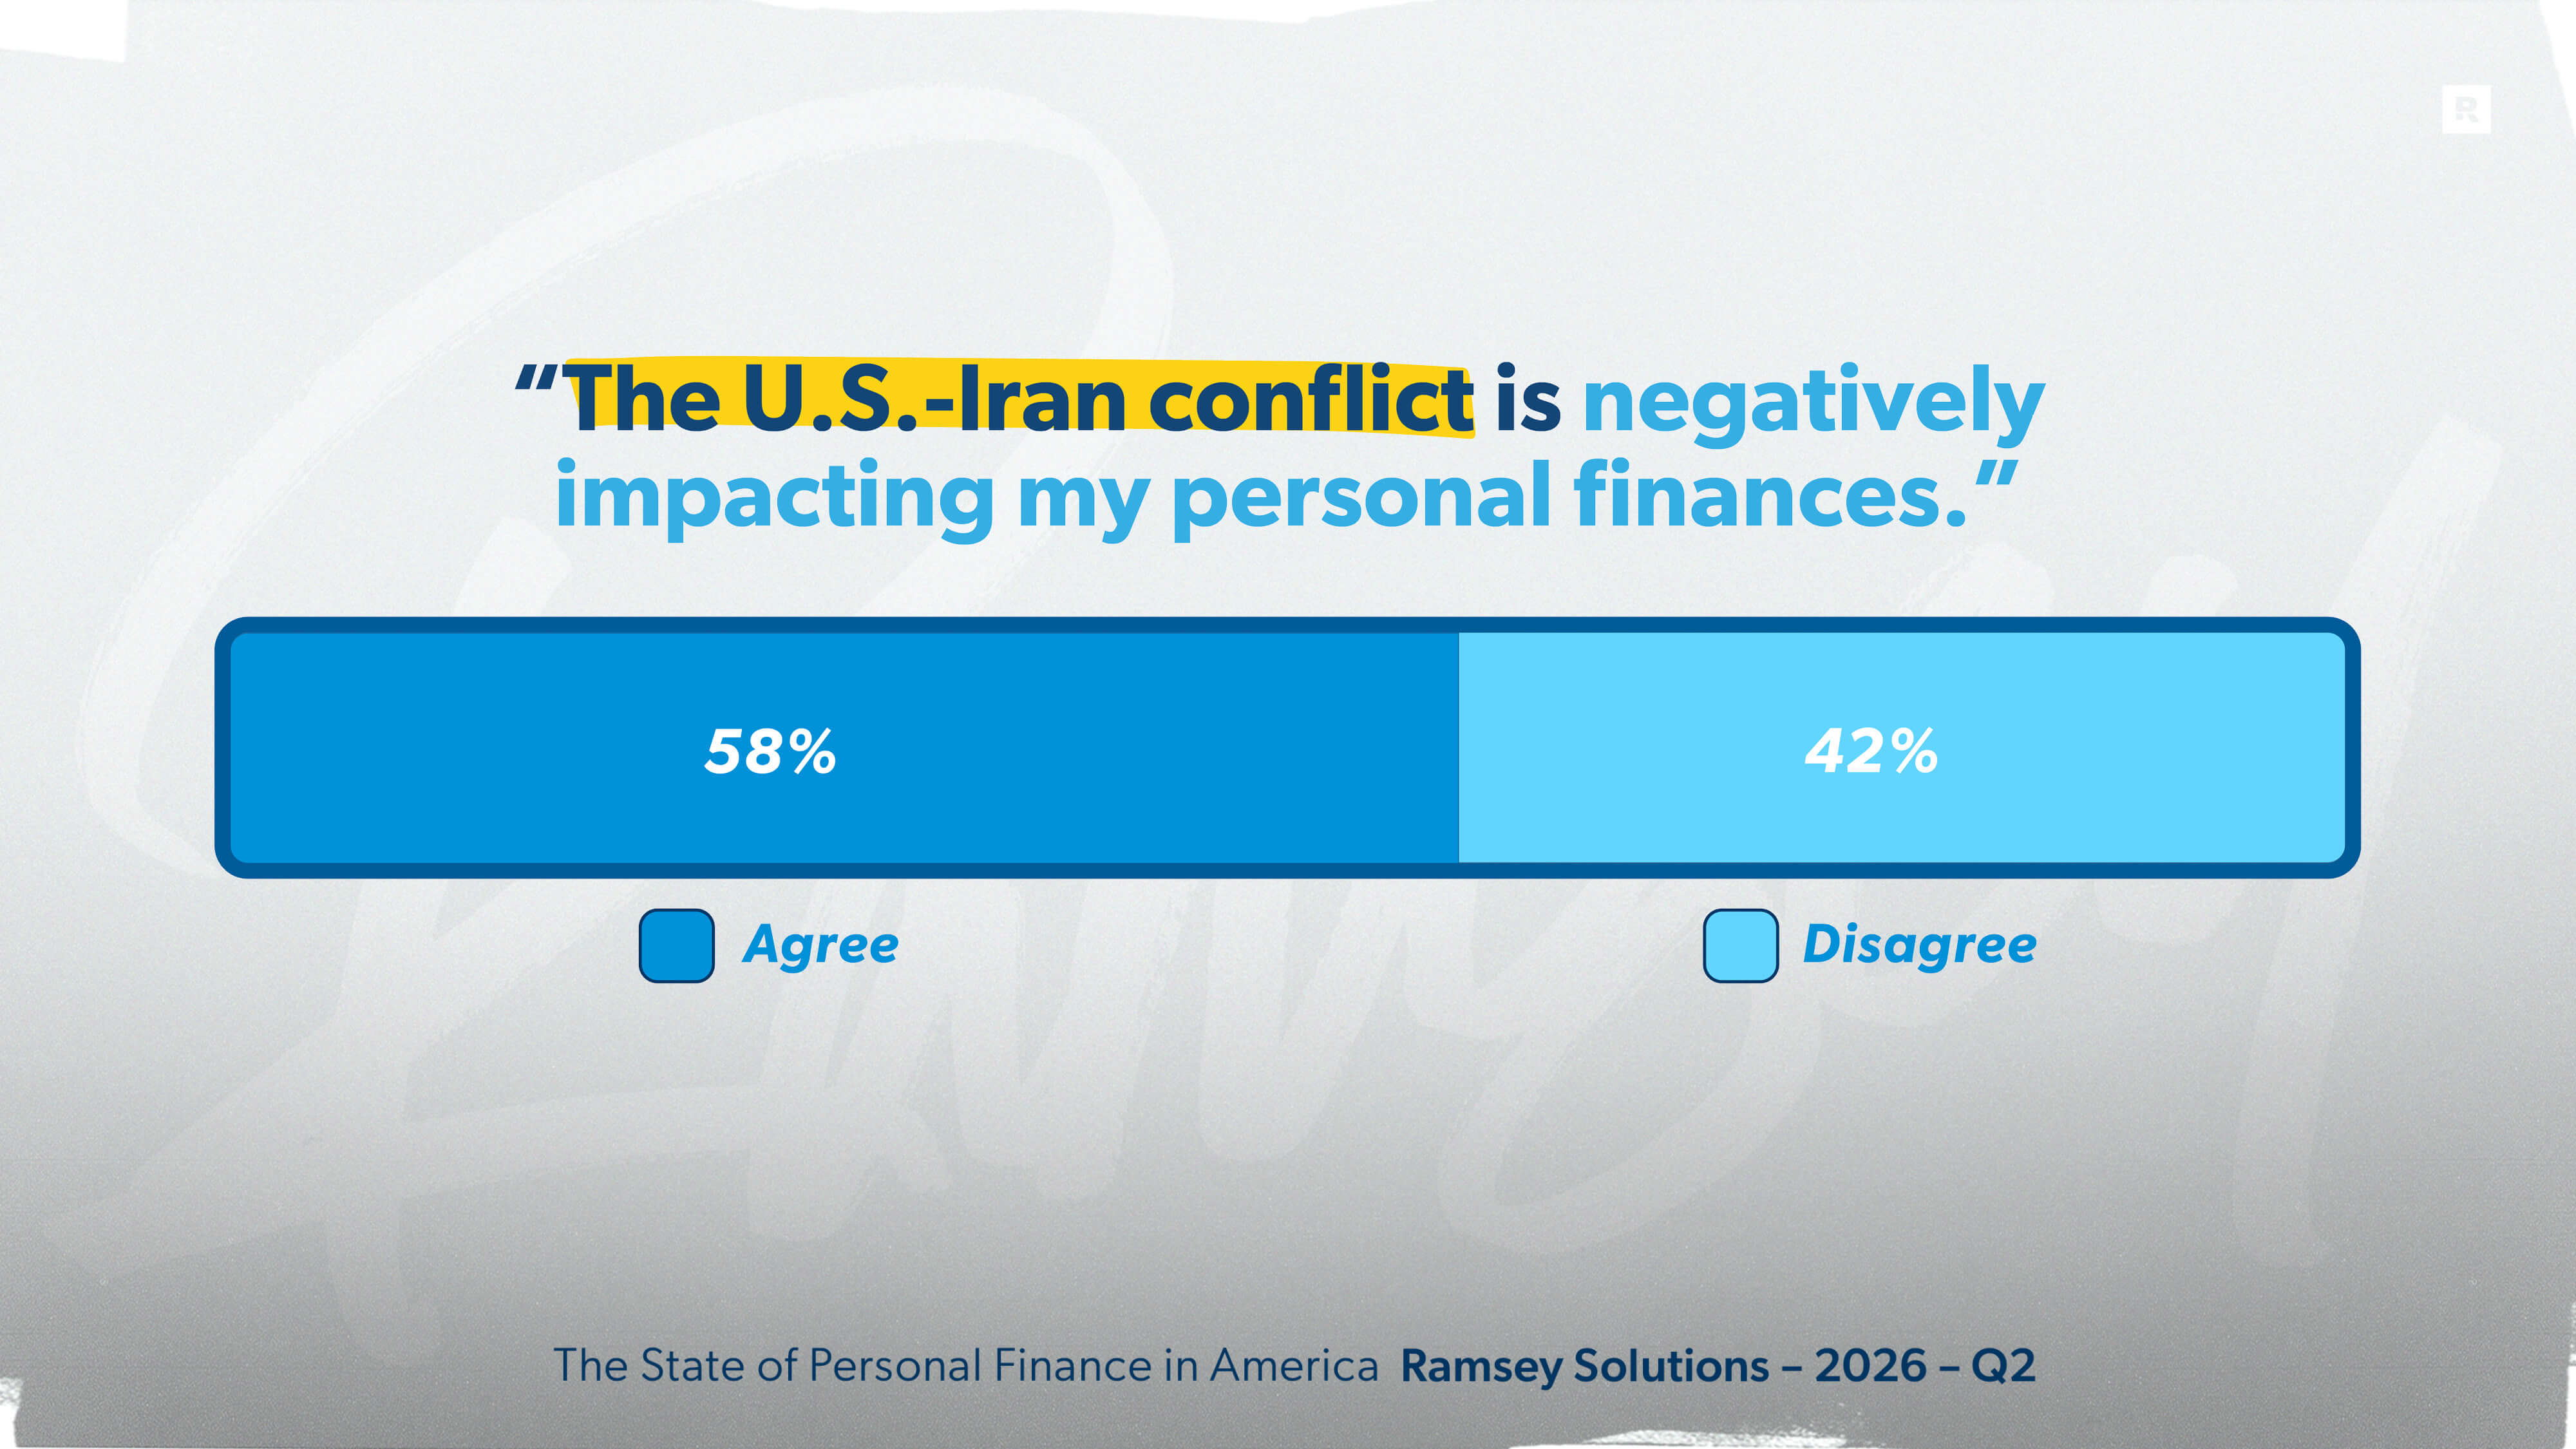
Younger Americans are feeling the impact of the conflict more. Sixty-eight percent of Gen Zers say the conflict is affecting their finances, compared to 53% of millennials and 58% of both Gen X and baby boomers. That pattern
makes sense, as people generally have less flexibility in their budgets to handle financial shocks early in their careers and become more financially secure as they get older.
Given the conflict’s political nature, it’s no surprise that political identity also shapes how Americans perceive the conflict’s financial impact. Three-quarters of self-identified liberals (74%) say it’s hurting their finances, compared to 42% of conservatives. No matter the reason for those answers—different economic circumstances, different interpretations of financial pressure, or plain political bias—the divide is substantial.
Notably, the middle-income bracket ($50,000–99,000) reports the highest rate of negative financial impact at 63%—higher than either lower- or higher-income households. These are Americans who are generally too financially stableto qualify for government assistance but not financially secure enough to ride out external events easily.
The main concern about the conflict for most Americans is the impact at the gas pump, as the drama in the Middle East has threatened free passage through the Strait of Hormuz, a main artery for global oil transport. Six in 10 Americans (59%) say they are driving less because of rising gas prices. And that behavior shift is consistent across demographics, though it falls heaviest on lower income households: 69% of those earning under $50,000 are driving less, compared to 52% of those earning over $100,000.
When every dollar is already committed to expenses, a price spike at the pump forces an immediate trade-off. And for households carrying consumer debt, gas prices add another layer of pressure. Sixty-four percent of Americans with consumer debt are driving less, compared to 53% of those who are debt-free.
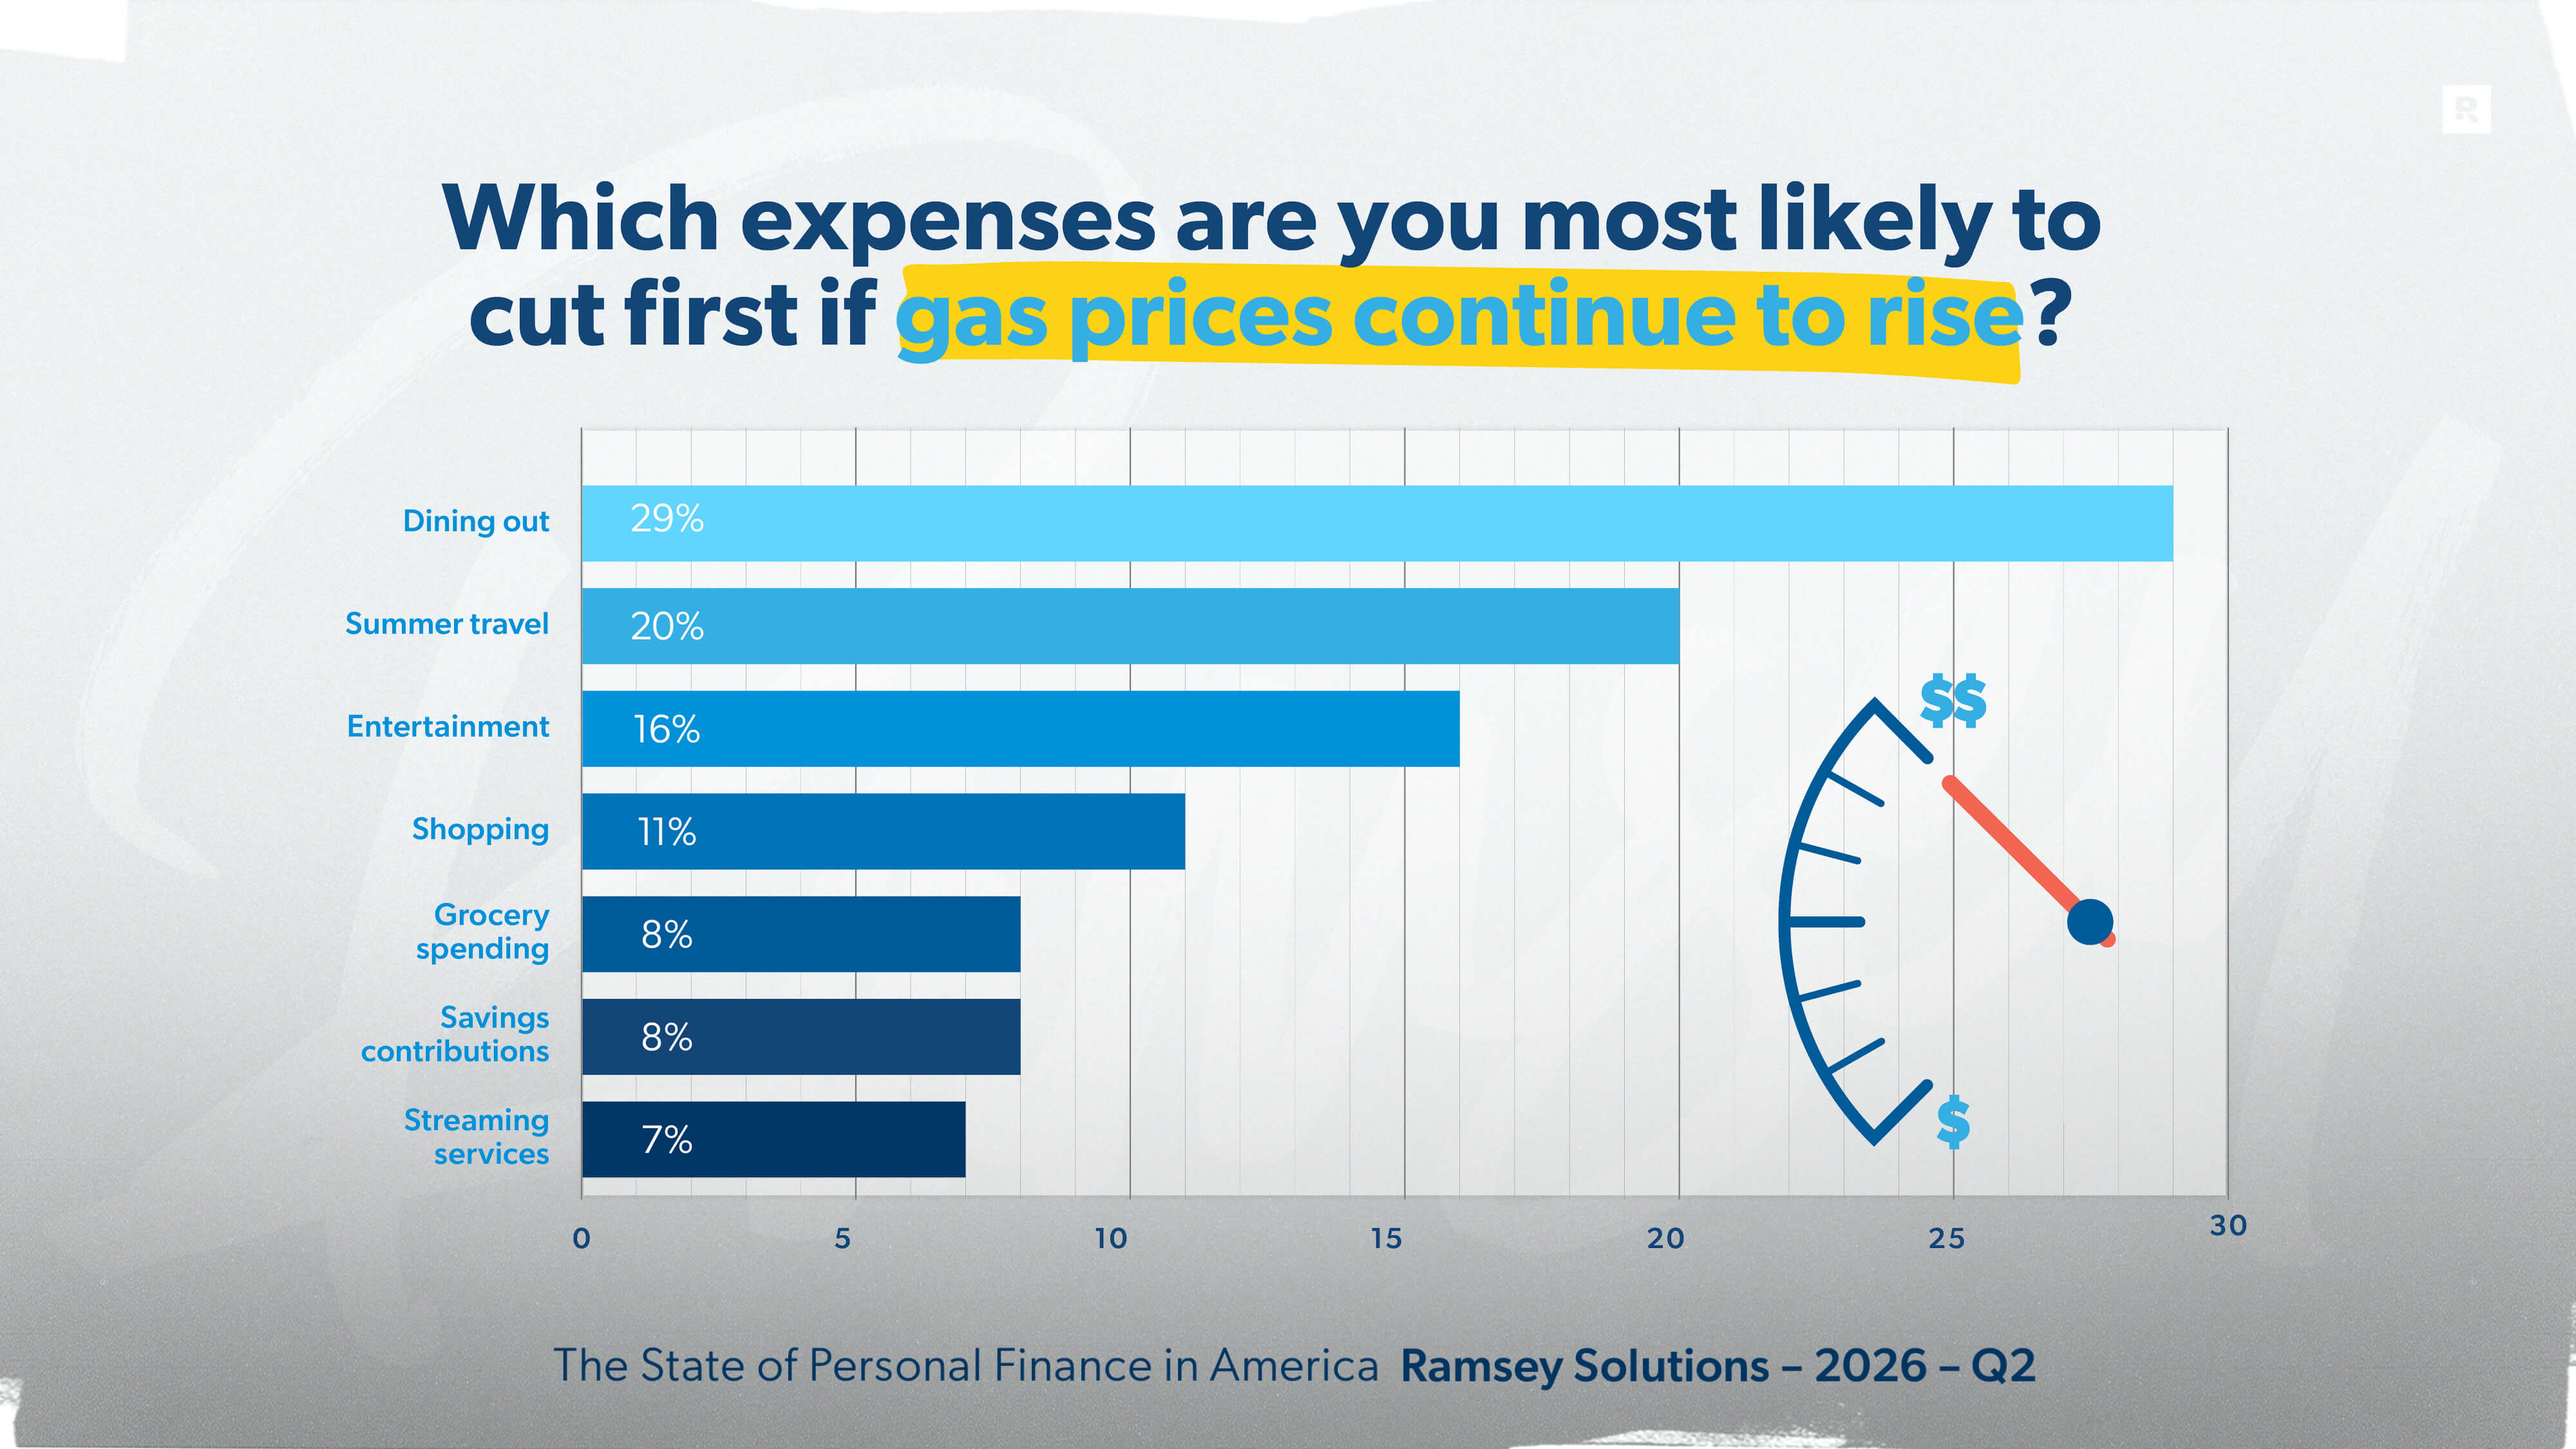
When gas prices rise, Americans have a clear order for what expenses they cut first. Dining out leads the list at 29%, followed by summer travel (20%), entertainment (16%), shopping (11%) and groceries (8%). Saving money and streaming subscriptions rank at 8% and 7%, respectively. So when it comes down to it, the summer road trip is more likely to get canceled before the monthly subscriptions.
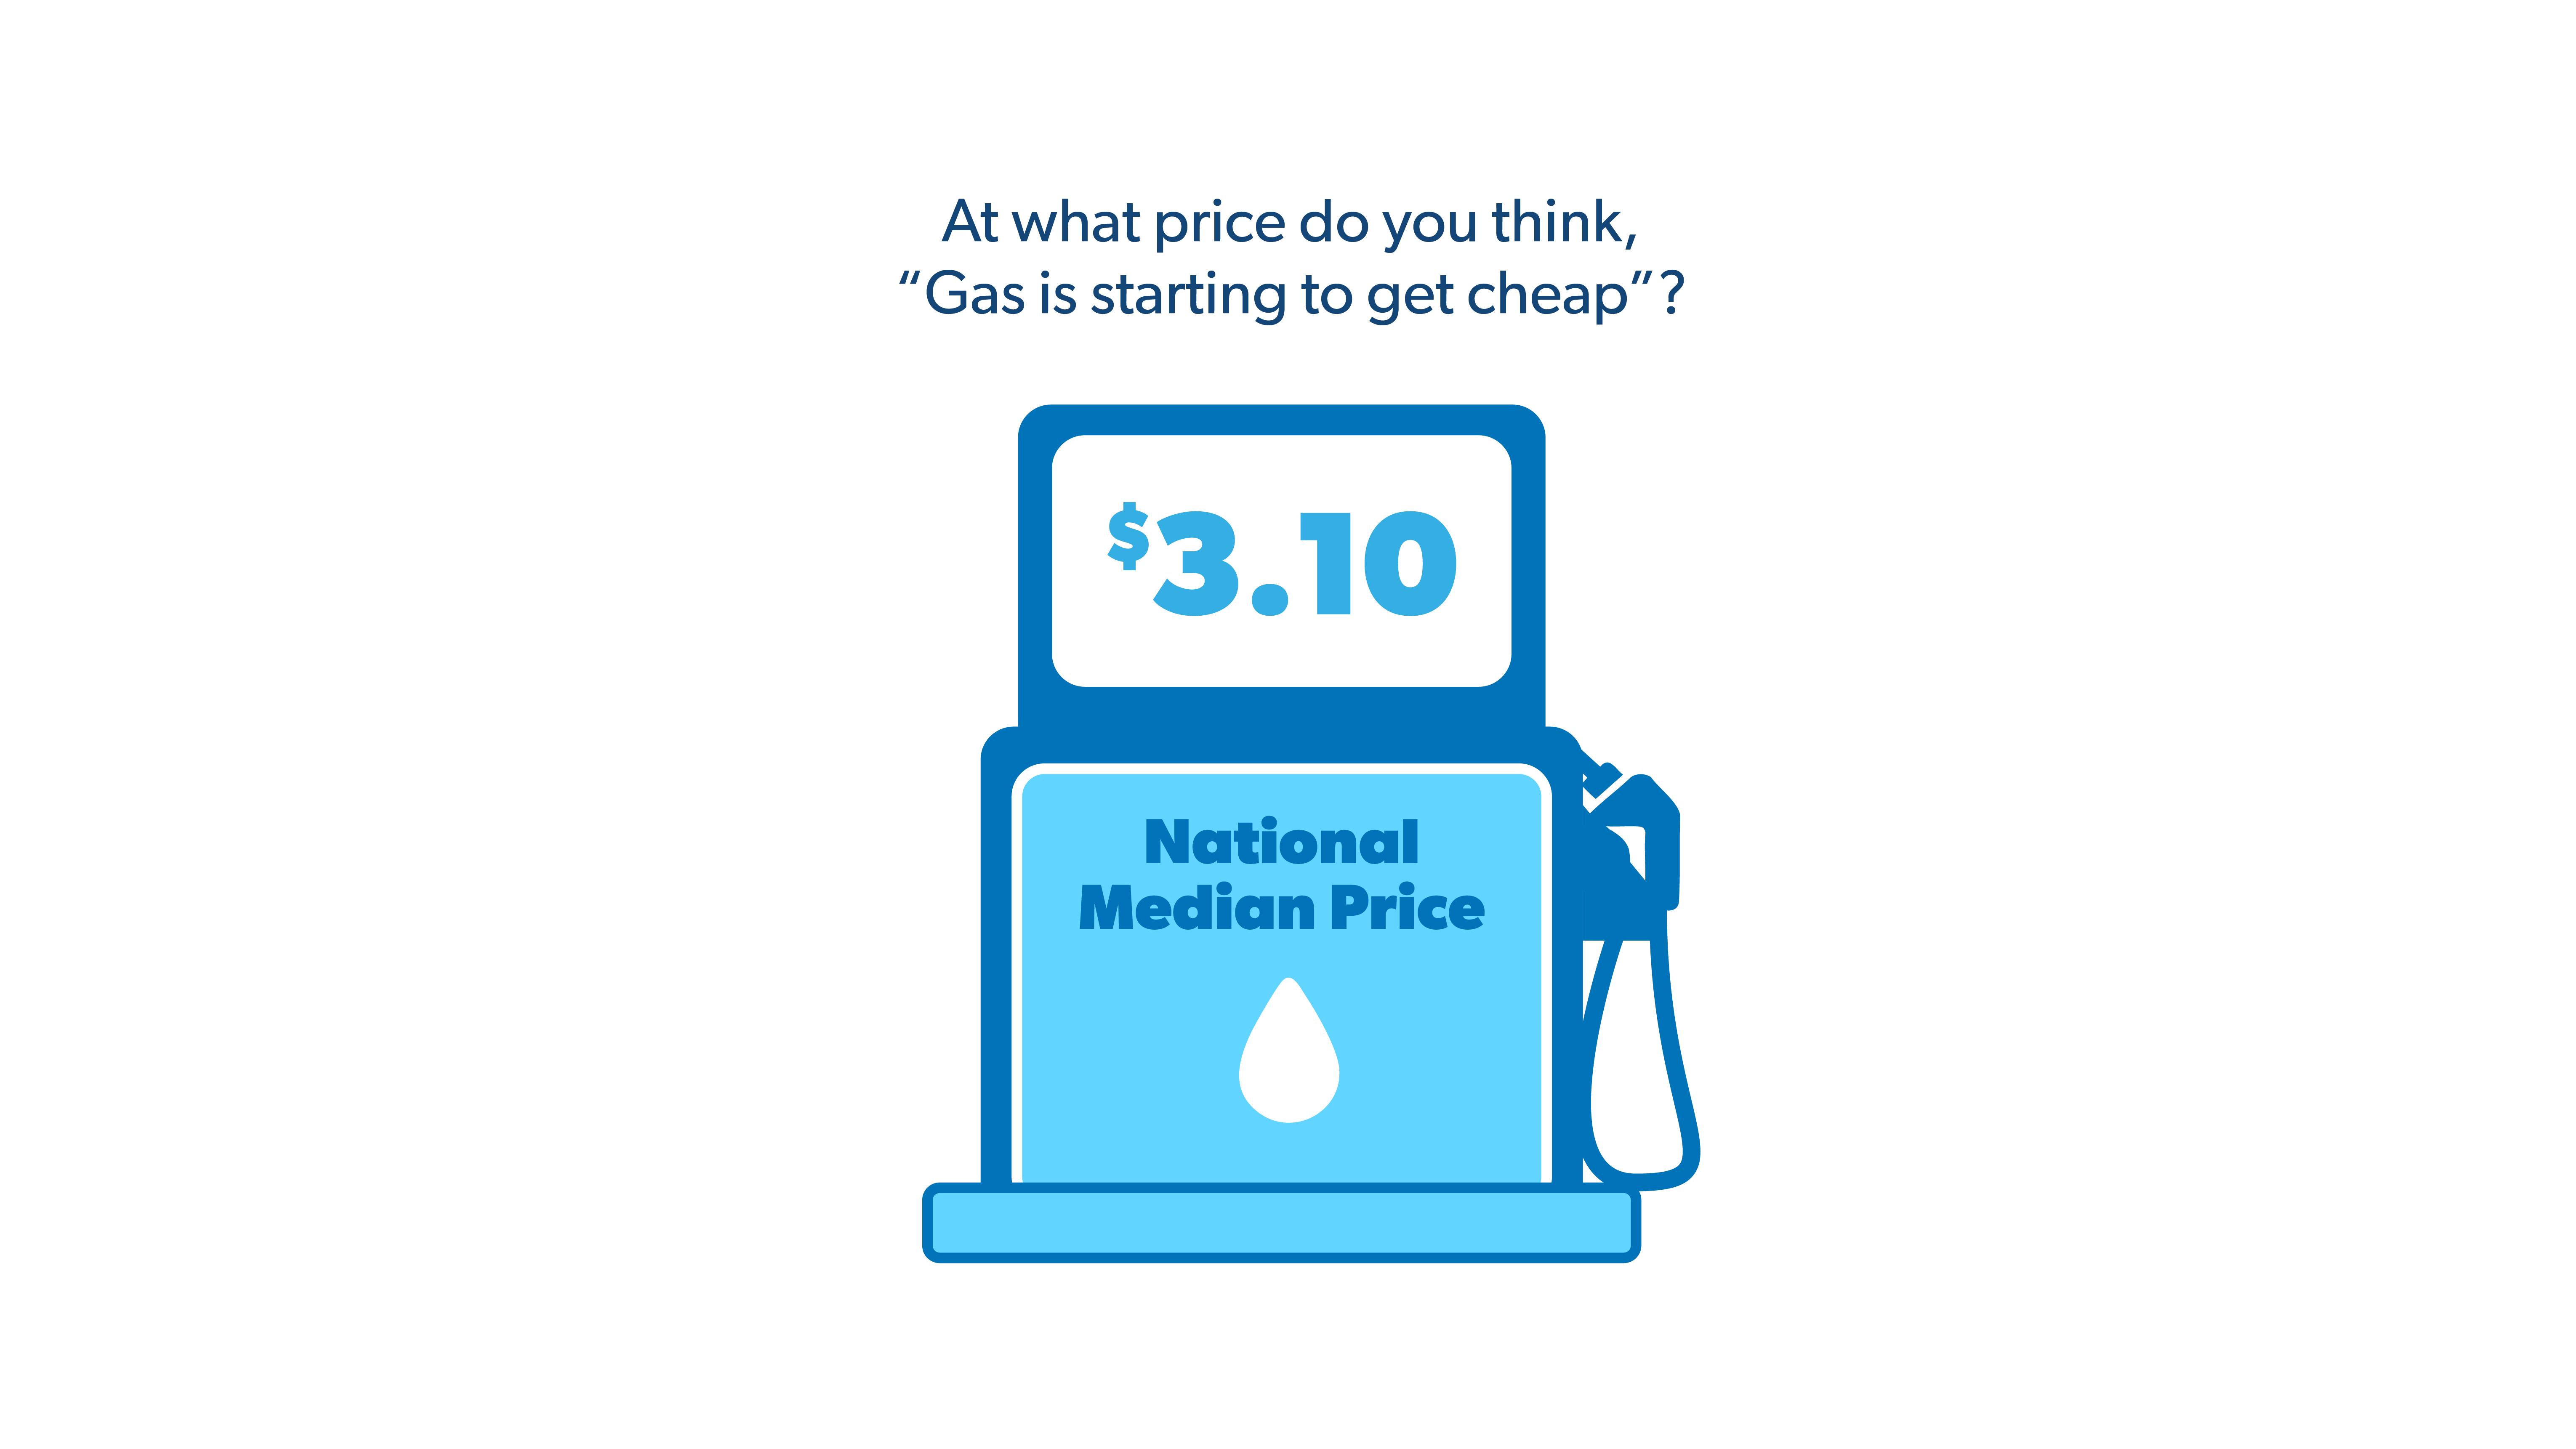
But what’s the number that causes people to finally say that gas is getting cheaper? We asked Americans what they thought a “cheap” price per gallon was, and the national median price turned out to be $3.10.
Debt Anxiety Is a Daily Reality for Many Americans
One-quarter of Americans (24%, or about 62 million people) say they worry about their debt every single day. Another 15% worry about it every week. Add in the occasional worriers and you’ve got 8 in 10 Americans carrying some level of anxiety about debt.
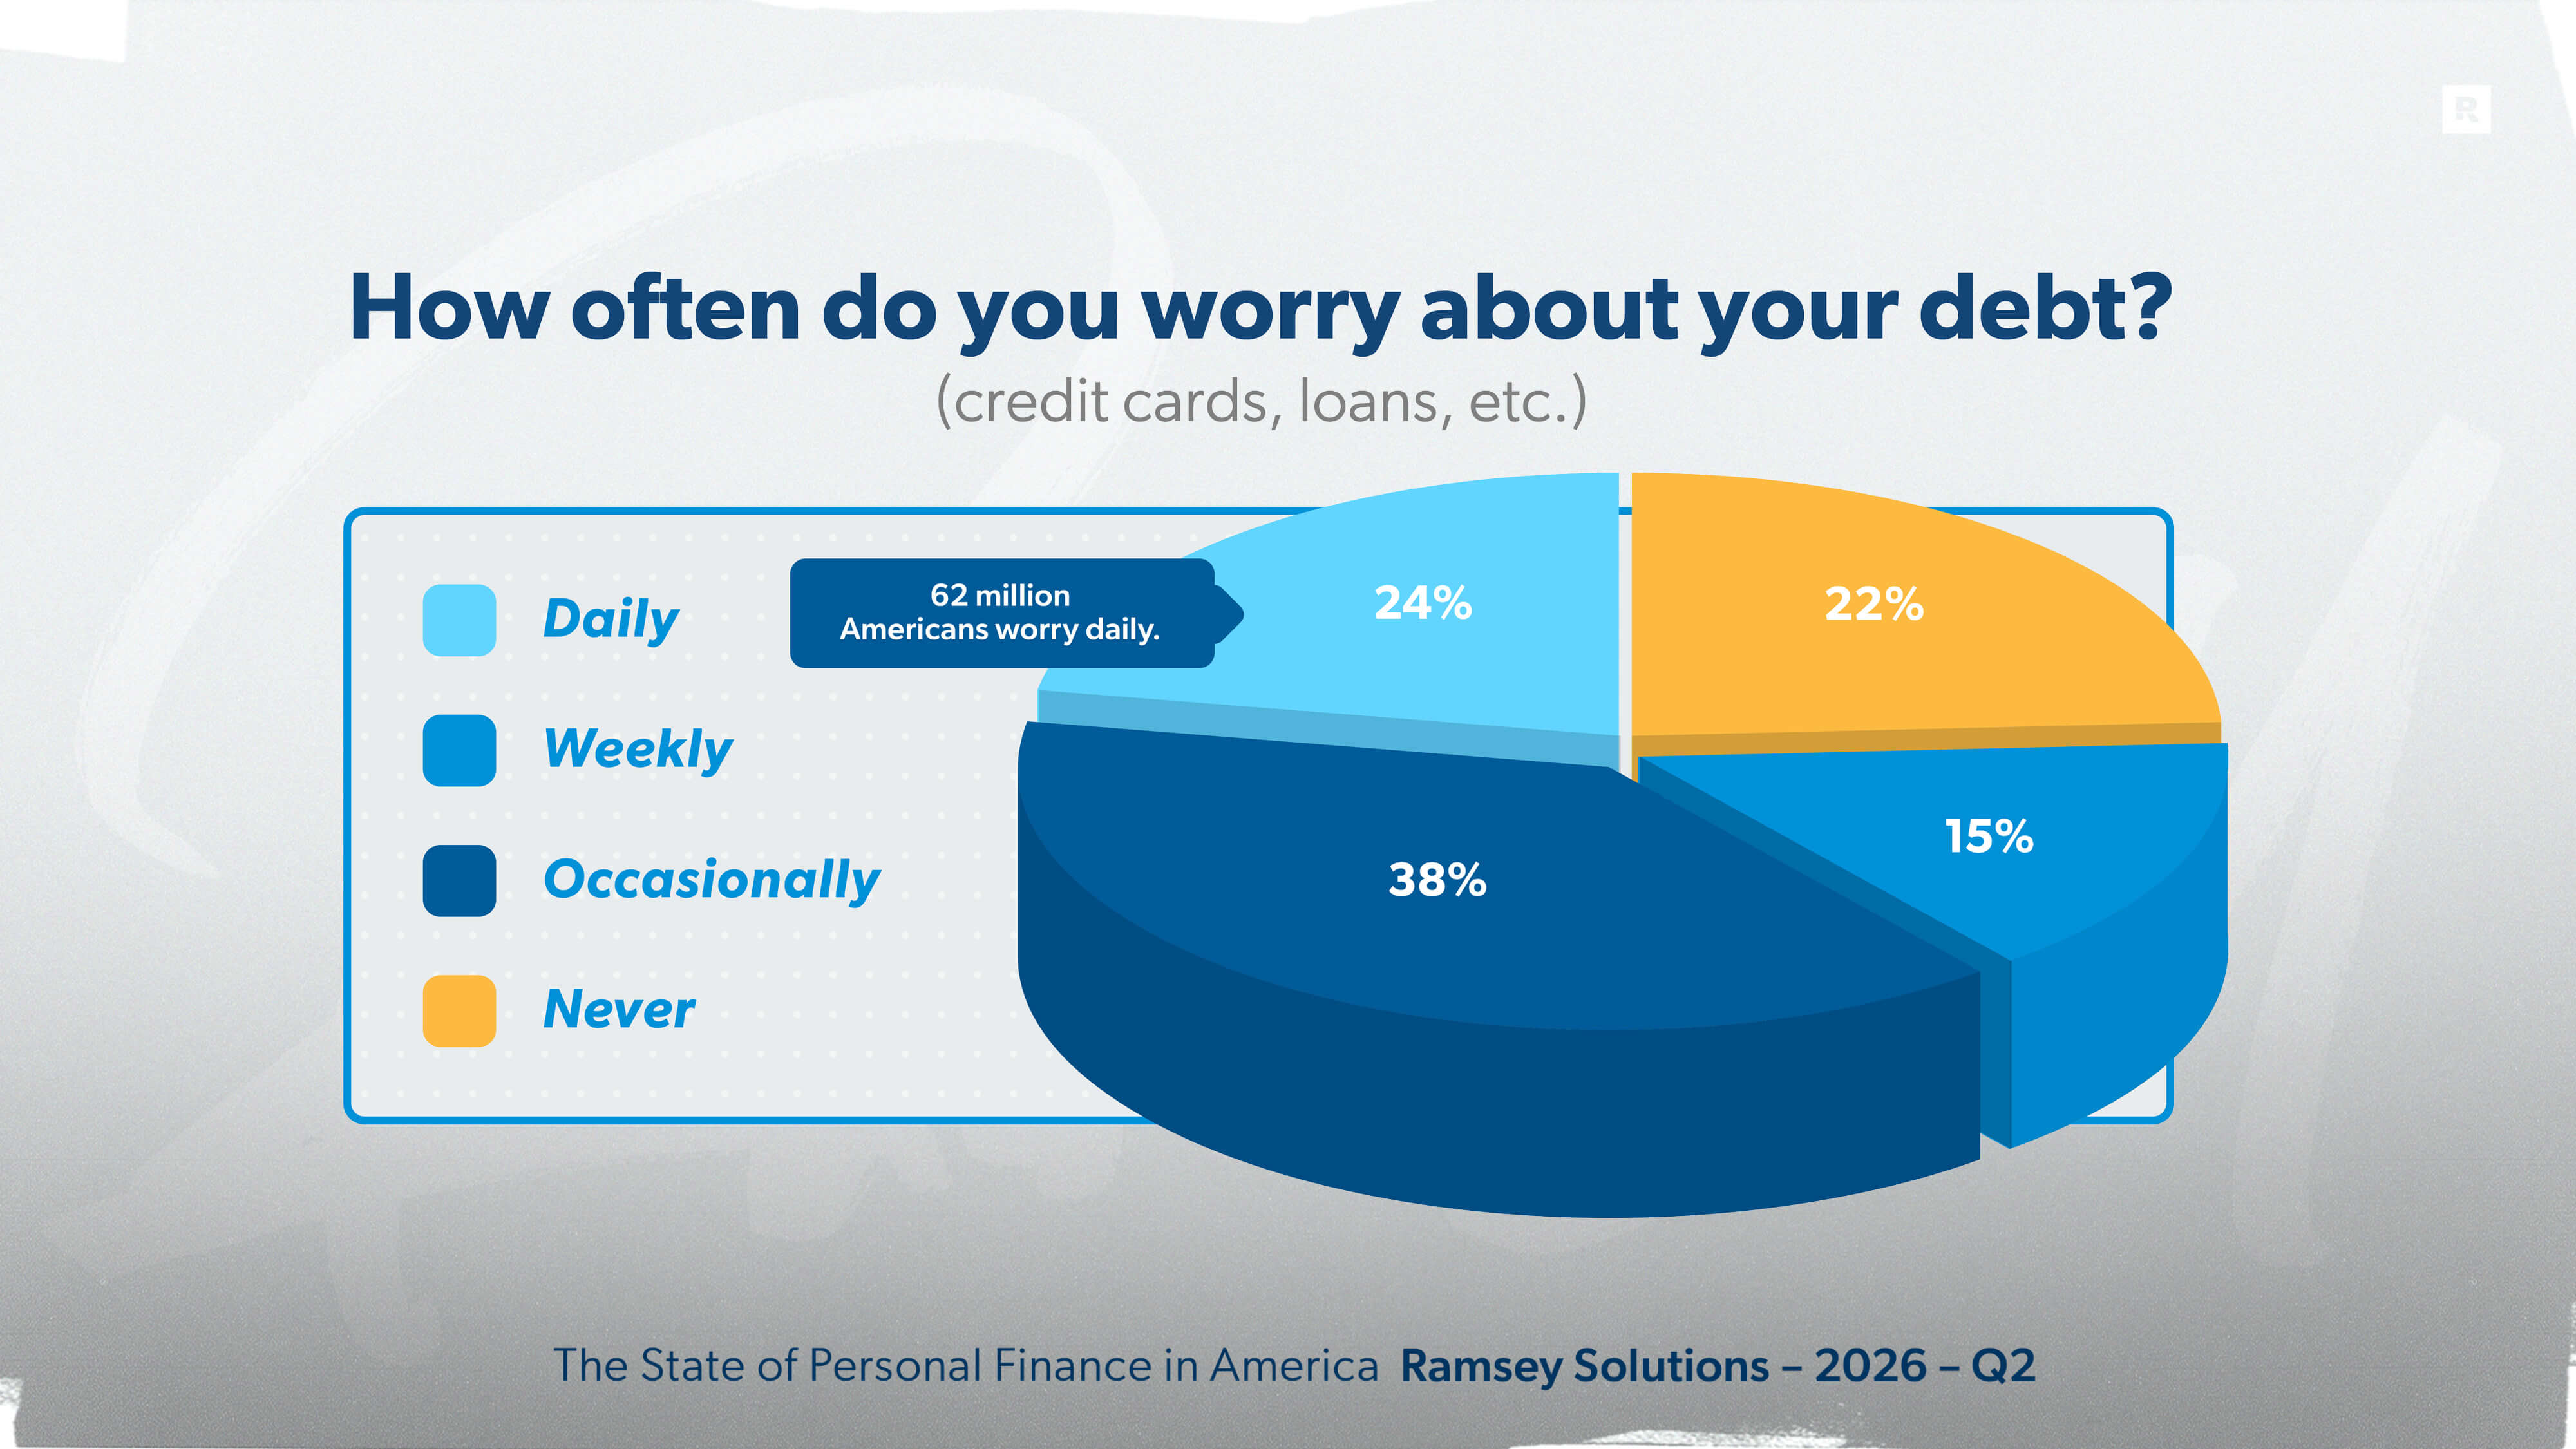
The weight is heaviest on those who can least afford it. Among Americans earning under $50,000, 39% worry about debt every day—nearly double the rate of higher earners. For those actively carrying consumer debt, 29% say daily worry is their reality. And for those who are debt-free, it’s no surprise that daily debt anxiety is essentially zero.
With Gen X in the middle of mortgages, car payments and credit card balances—along with raising children and planning for retirement—it’s no shock that they carry the most debt anxiety of any generation. Thirty percent worry about it daily, compared to 13% of baby boomers.
Despite the daily grind, most Americans are focused on what lies ahead rather than what’s pressing now. Sixty-one percent say they are more worried about their long-term financial future than their current bills. That forward-looking
mindset is a healthy sign . . . if it leads to behavior that actually prepares them for what’s coming. The exception to this thinking is lower-income and debt-carrying households, where about half say current expenses block out long-term thinking.
What does all this point to? Debt-free Americans feel more financially independent and carry less stress about money than the 62 million of their fellow citizens who worry daily about debt.
All Agree: Gen Z Has It Bad Financially
Ask Americans which generation has it hardest financially today and the answer leans young. About one-third of Americans (36%) say Gen Z faces the toughest financial road—though millennials aren’t far behind (31%).
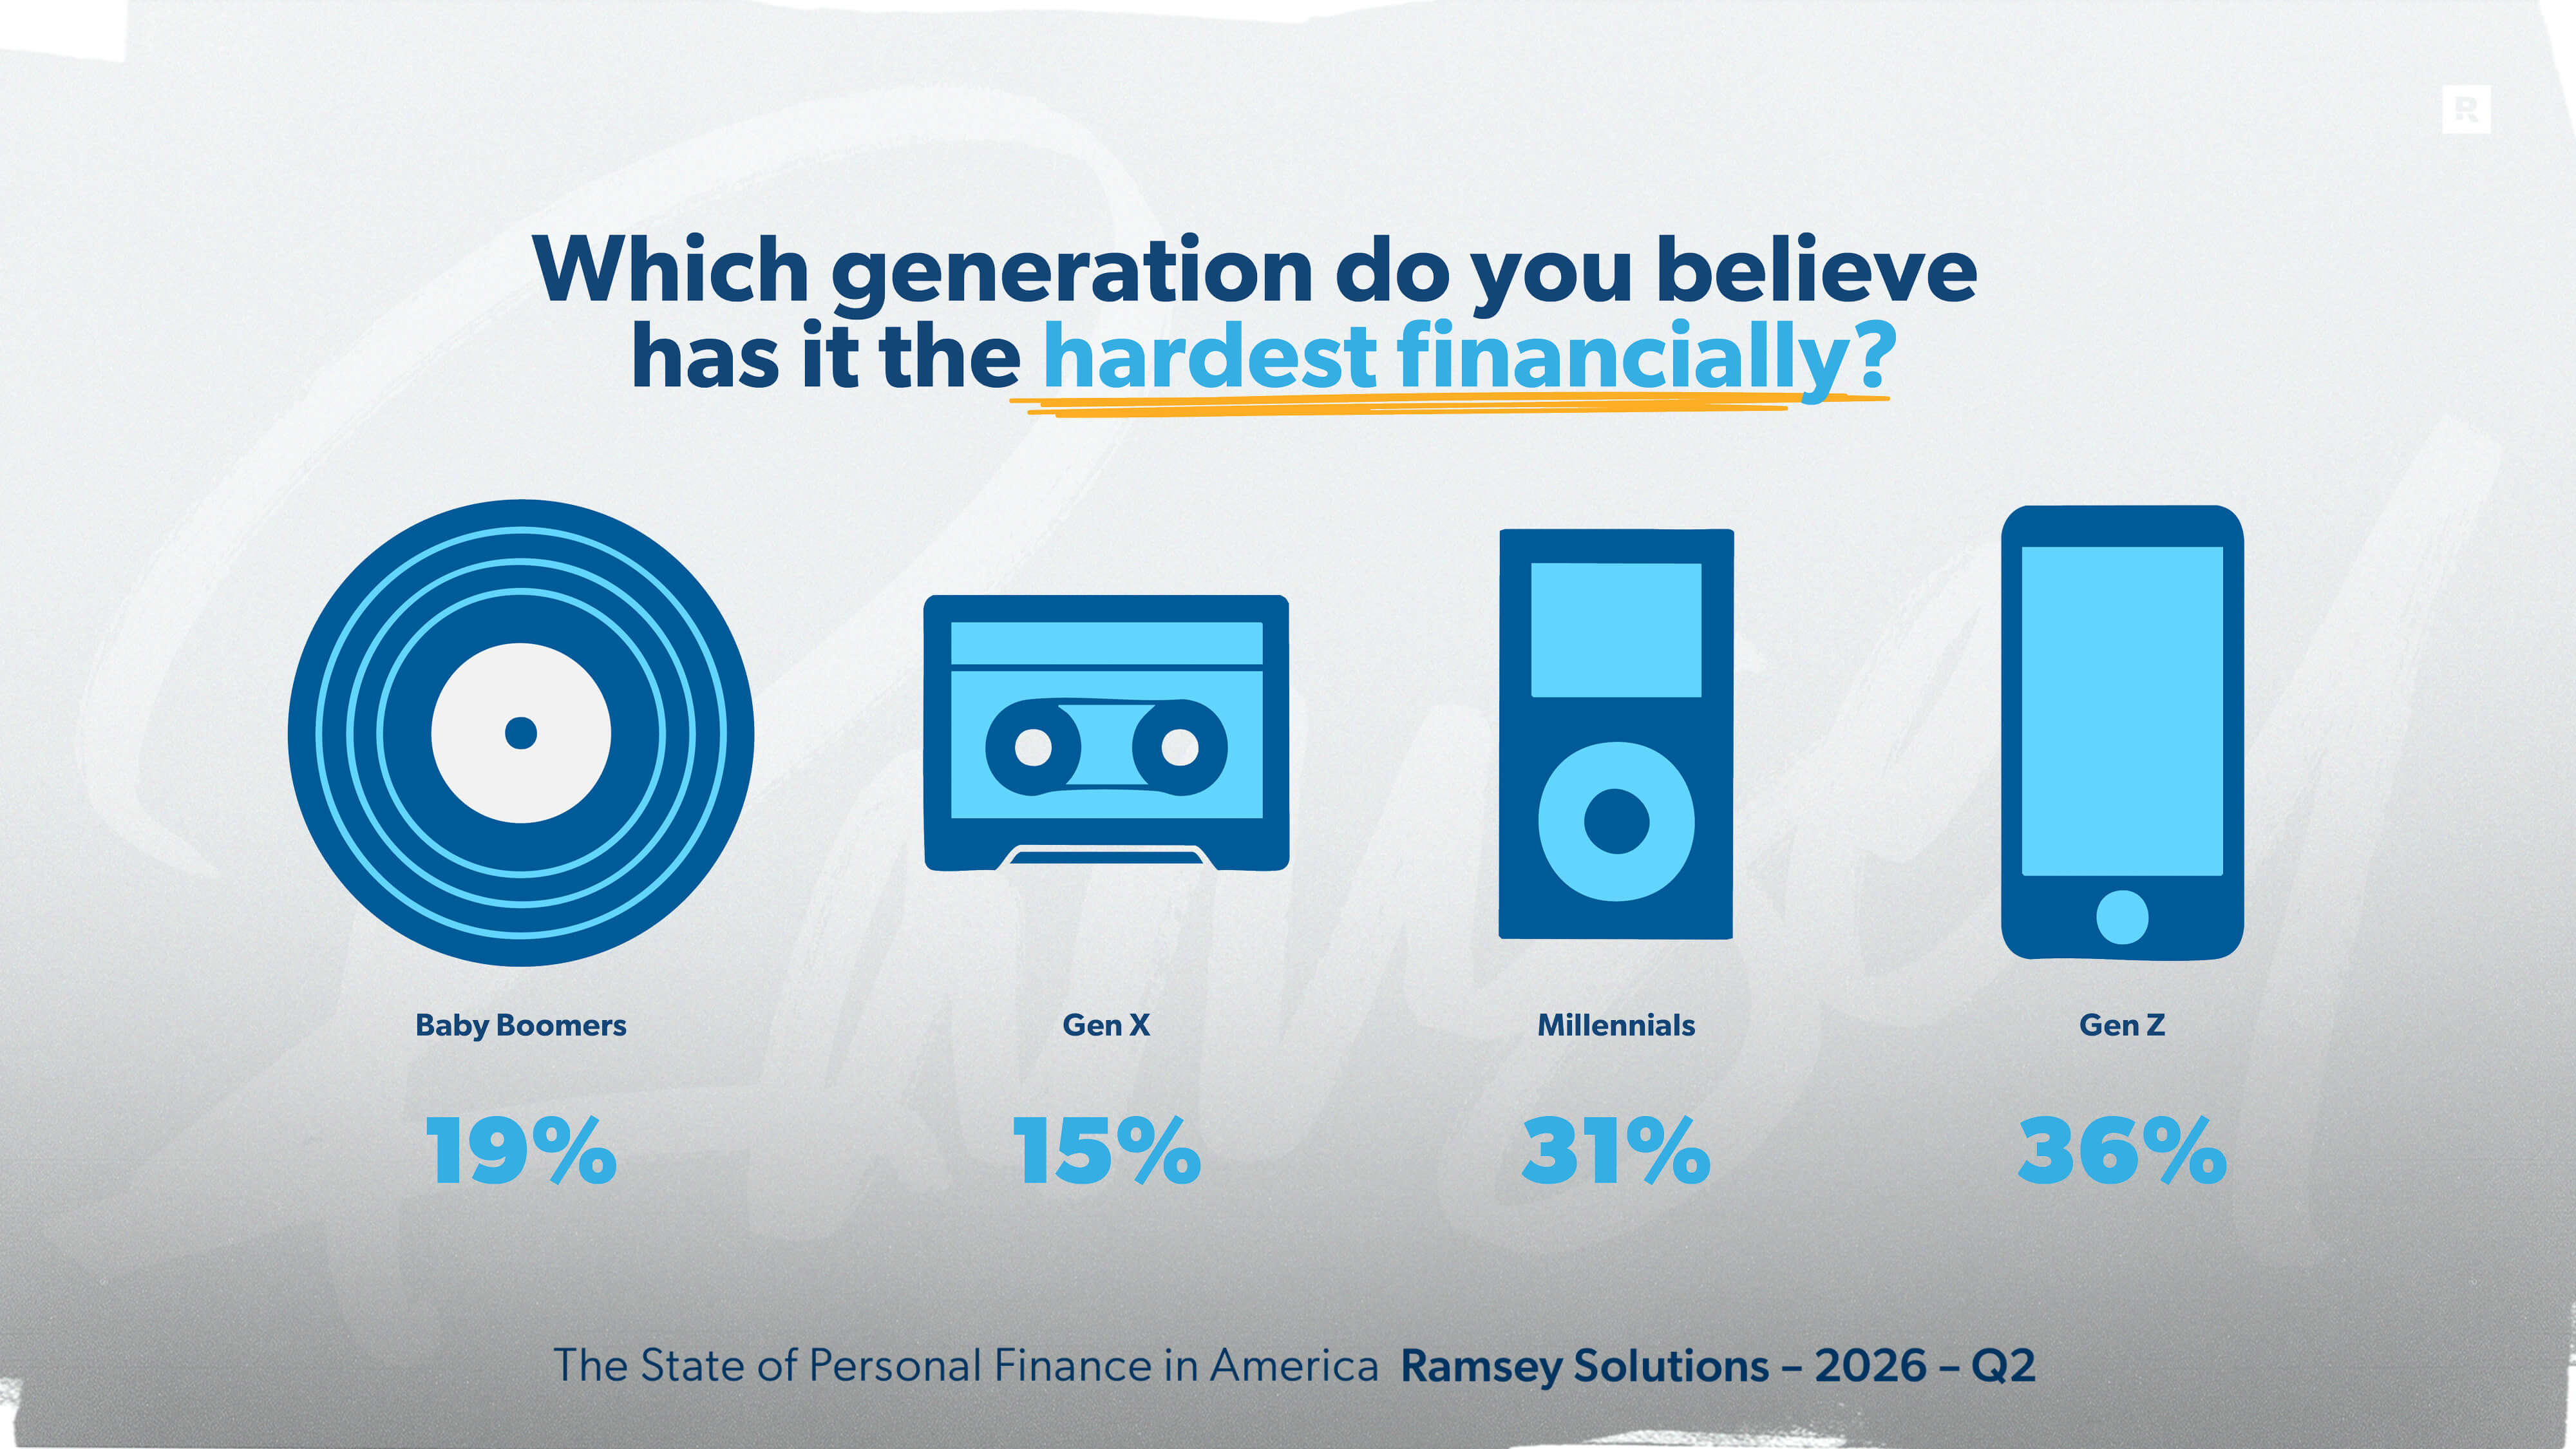
Naturally, a supermajority of Gen Z itself (79%) says their generation has it the hardest. And that assessment stretches across generational lines. Even 24% of baby boomers agree that today’s youngest adults are navigating more difficult financial challenges than they faced.
But where do these feelings come from? Many believe that younger generations are living in a fundamentally different economy in which normal, achievable financial goals are now more difficult to attain.
When Americans were asked which financial milestones feel more financially impossible today than they did for previous generations, the top answer surprisingly wasn’t homeownership. It was living on one income—cited by 31% of respondents. Homeownership came in second at 25%, followed by retiring comfortably (19%), raising children (8%), and paying for college (7%).
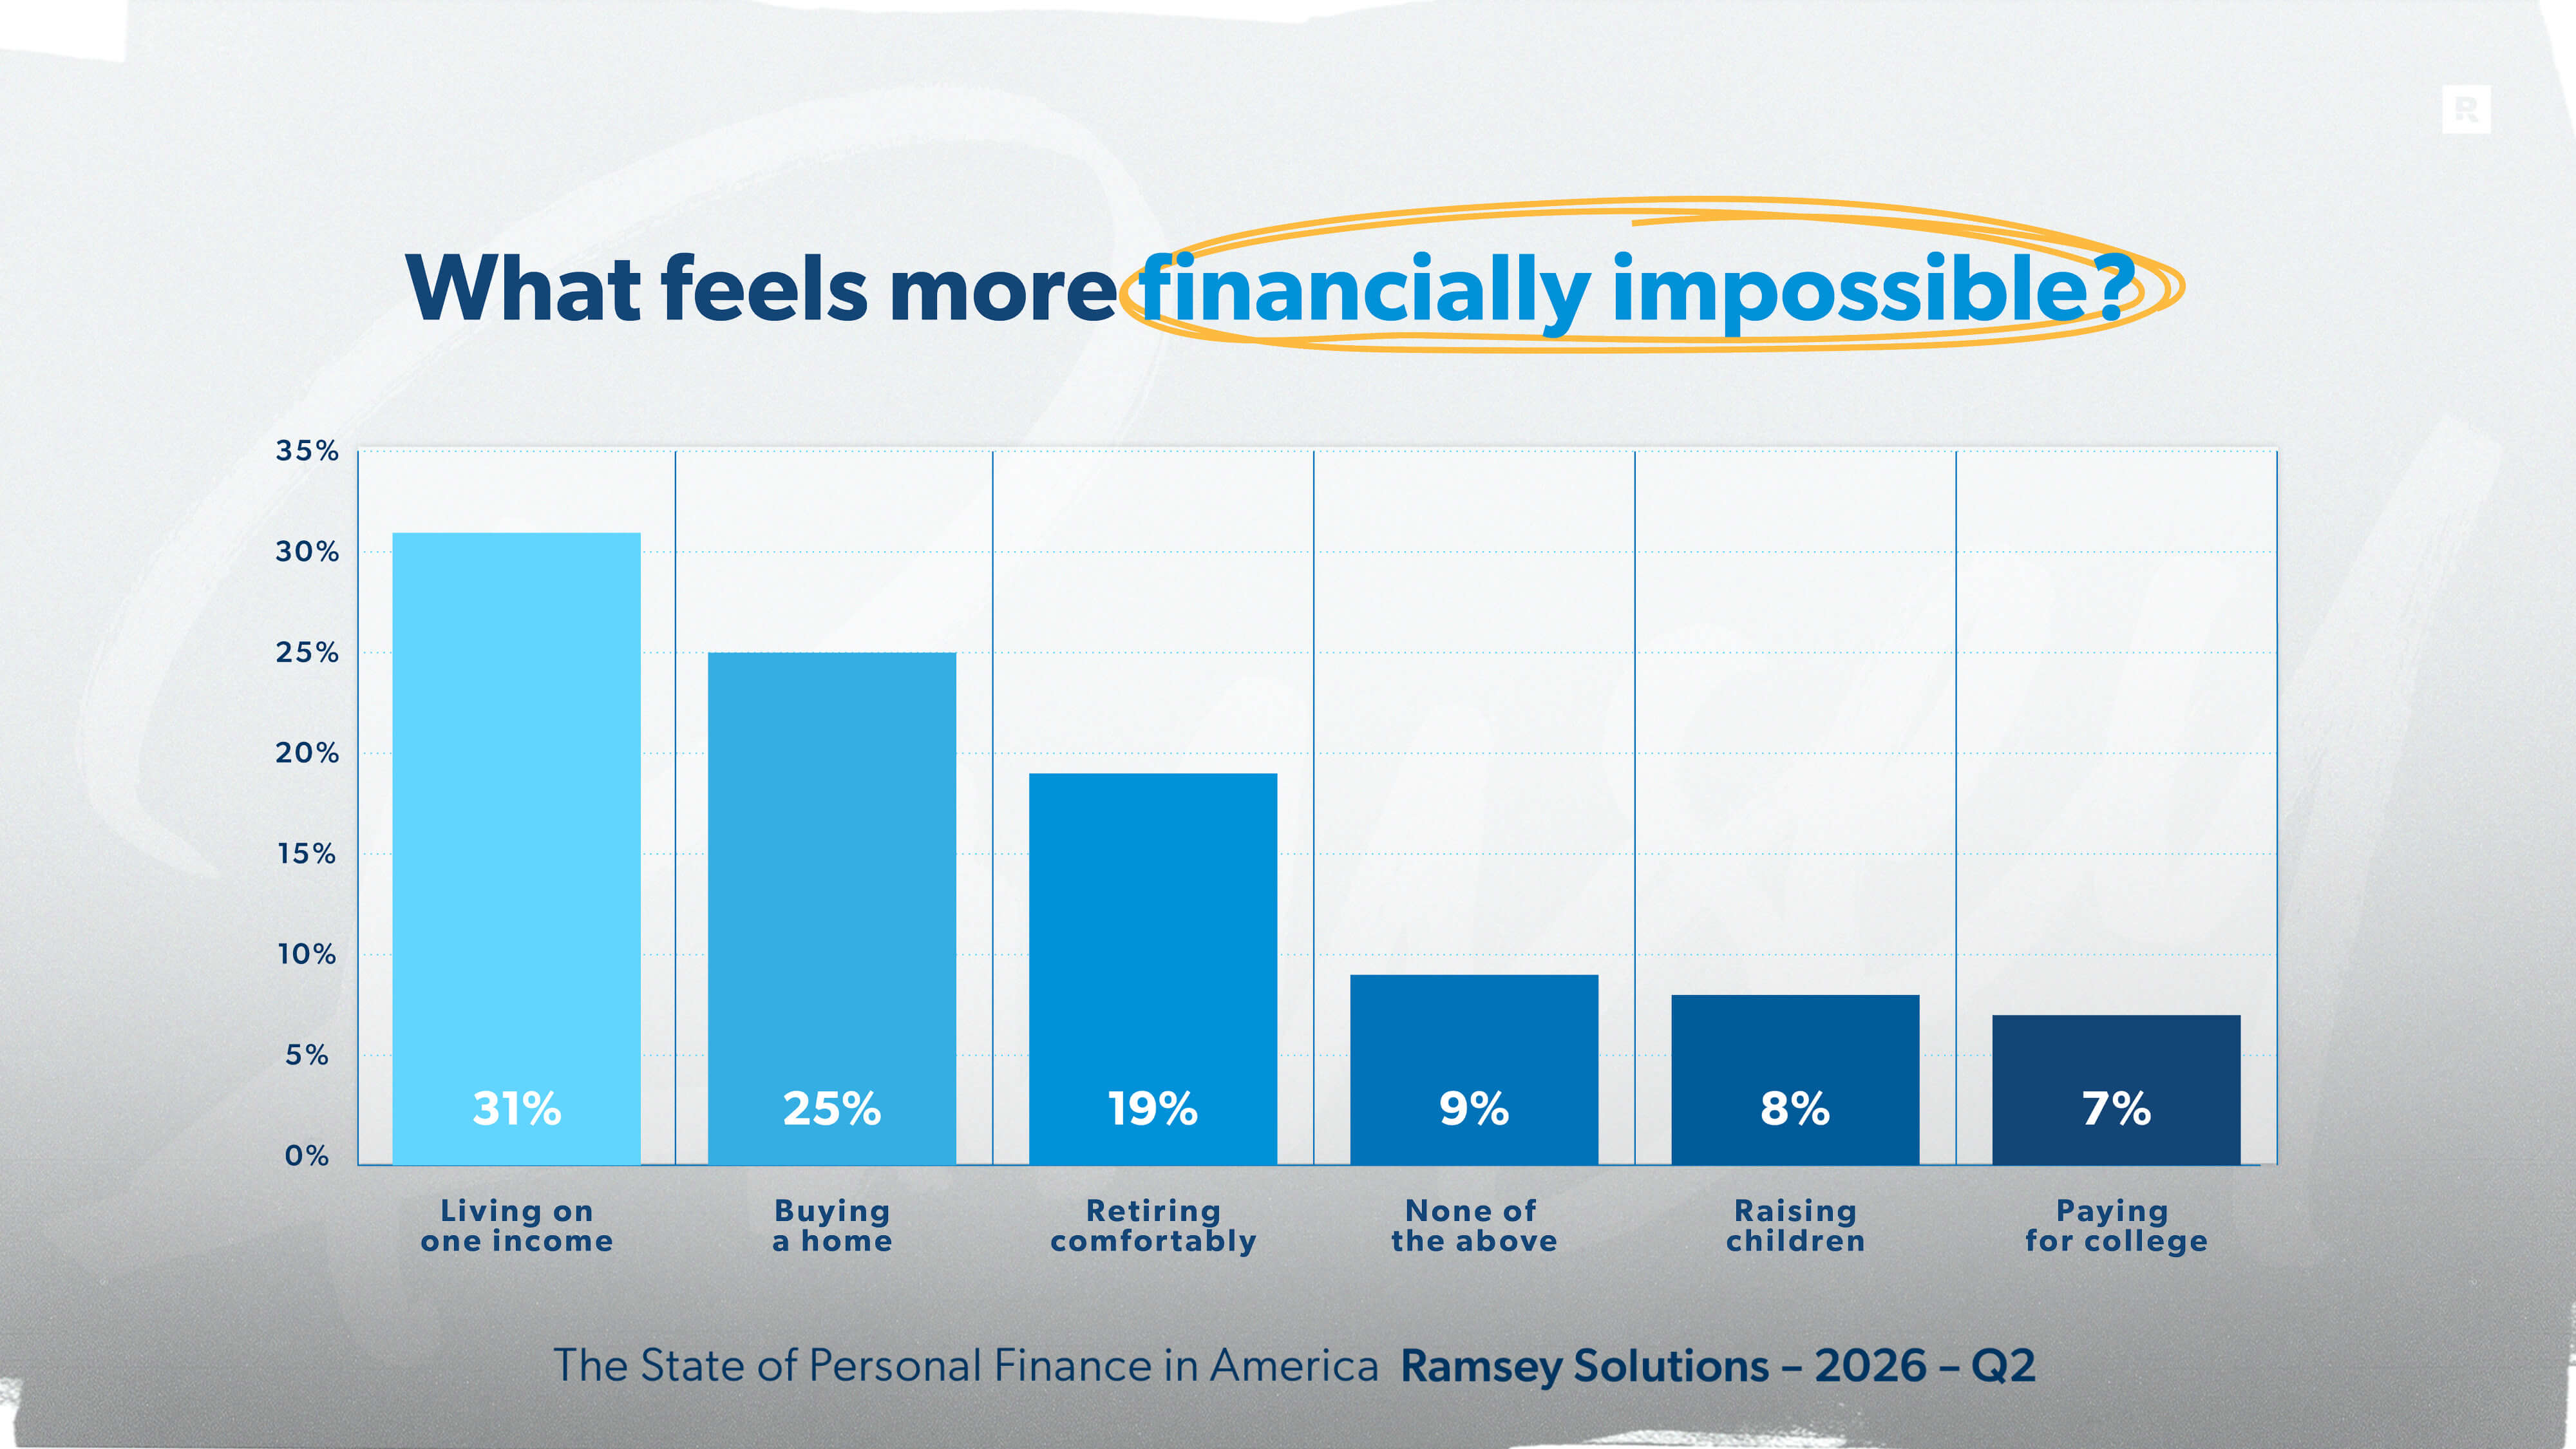
For much of the 20th century, a single-income household was the baseline in America, not the exception. Today, the prospect of one person supporting a household feels more out of reach than owning property. This is another instance of all generations agreeing, with around 30% of all age groups saying a single-income household is impossible today. However, Gen Z is most likely to say that buying a home is impossible (34%) compared to millennials, Gen X and baby boomers (29%, 21% and 22%, respectively).
The Brown Bag Economy: Small Choices, Big Shifts
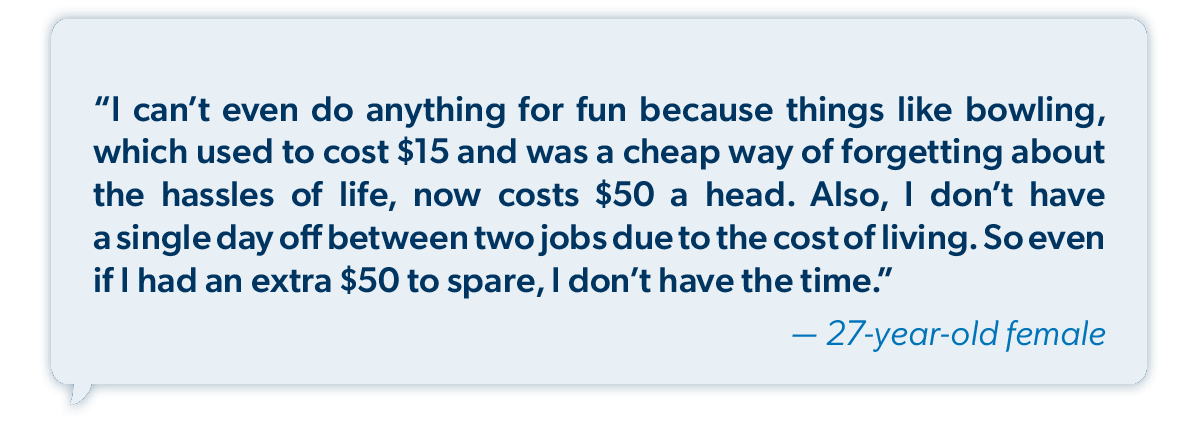
Because of the perceived difficulties in reaching financial milestones, a measurable change is happening in how Americans make small financial decisions.
We’re calling it the Brown Bag Economy—a cultural shift toward more intentional spending and saving. And it’s accomplished through wiser choices in all the seemingly small spending decisions we make, such as packing lunches in a brown bag instead of eating out.
Ramsey tracked 26 specific behaviors across four categories: food, shopping, budgeting and resourcefulness. Respondents indicated whether they were doing each behavior more or less than they were three months ago. The results reveal a definite shift in how everyday Americans are managing money.
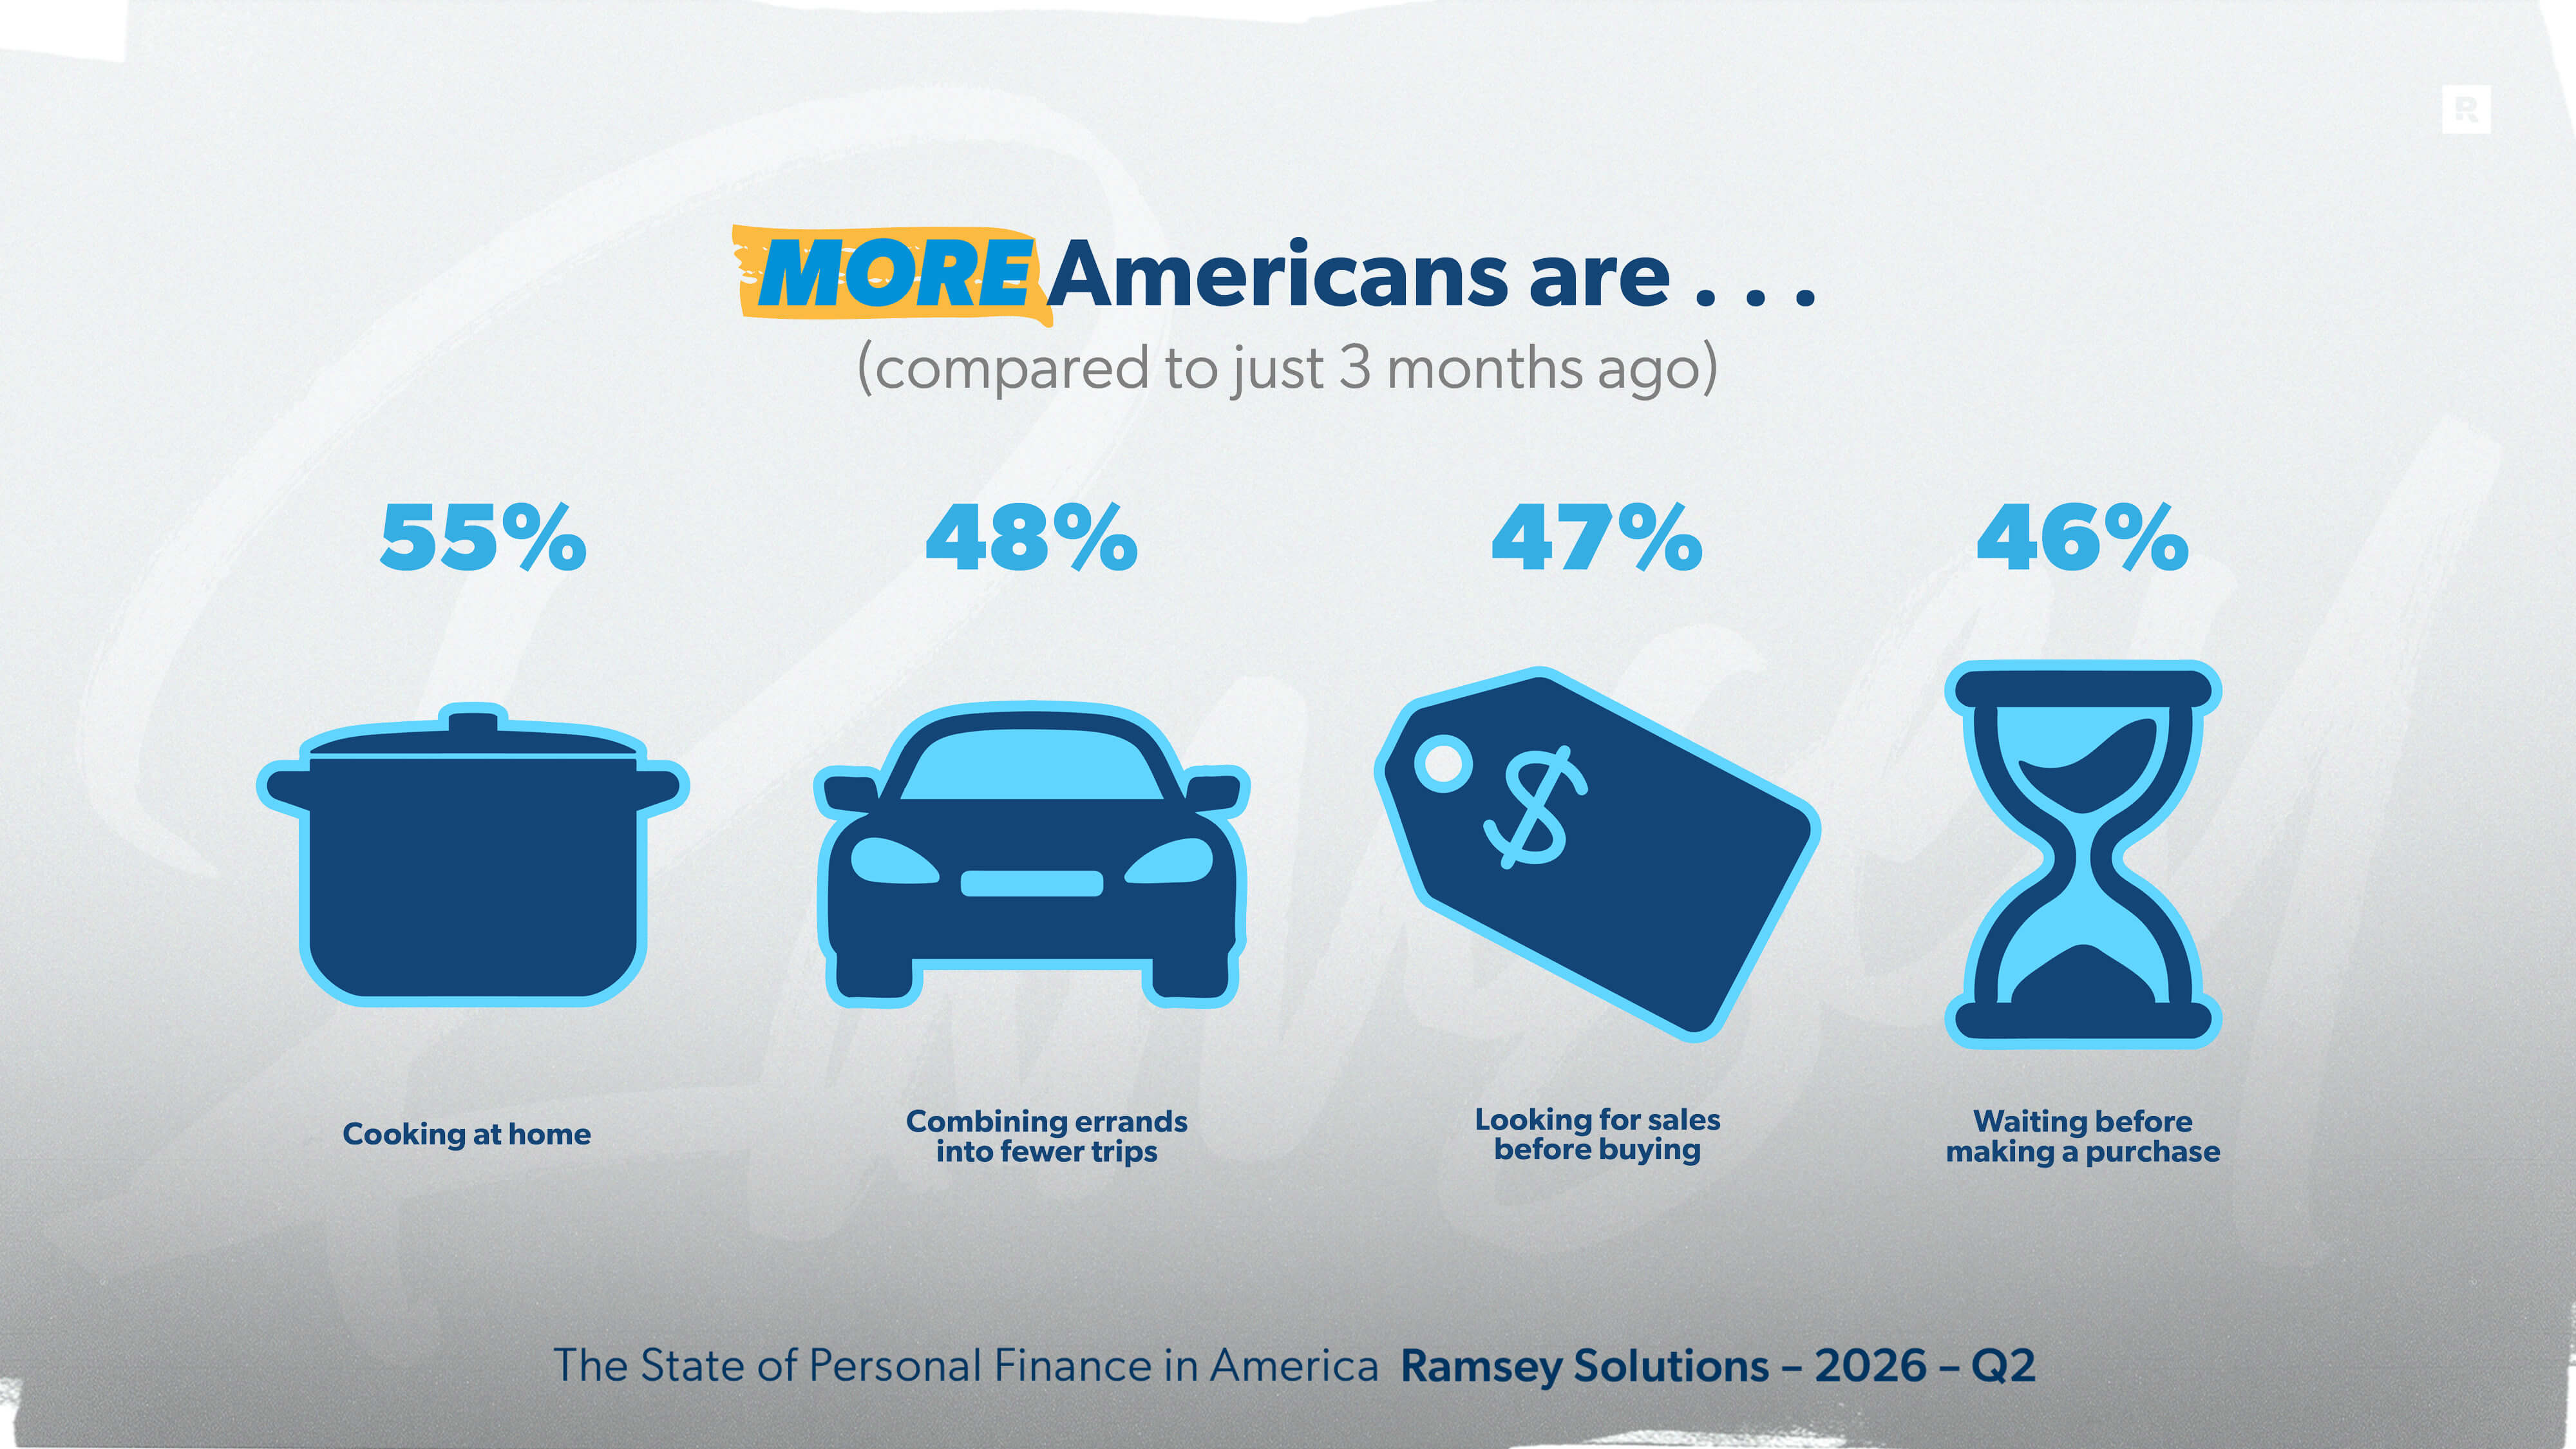
Cooking meals at home is the most widespread behavior change in the study, with 55% of Americans doing it more often than they were three months ago. Almost half (48%) are combining errands into fewer trips (more than likely
a direct response to gas prices). And around the same number of Americans are looking for sales before purchasing (47%) and deliberately waiting before making a purchase rather than buying immediately (46%).
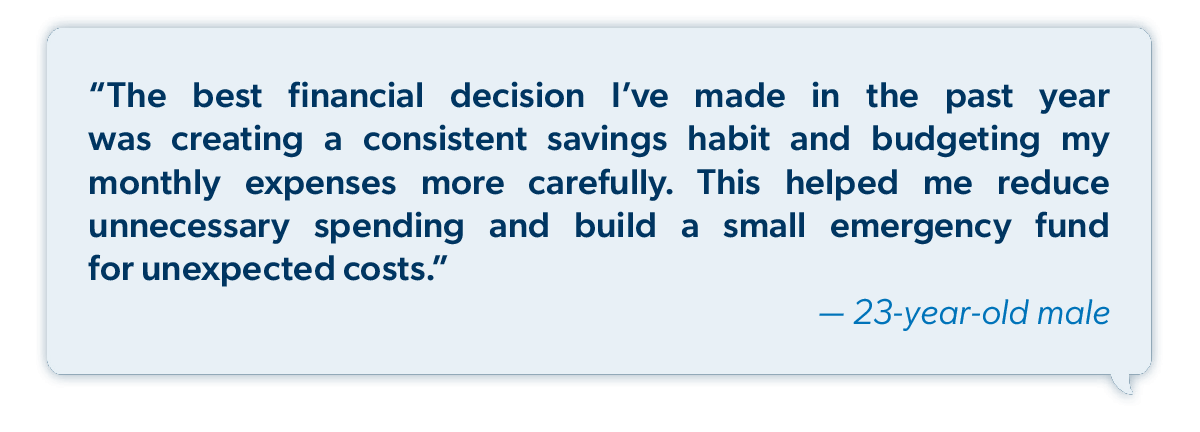
Intentional saving behavior is also up, and it seems that the generation with the most urgent financial need is also the most attentive to where money is going. Twenty-two percent of Americans say they are saving more from each paycheck, with Gen Z leading all generations at 40%. More than one-third of Americans (36%) are tracking every dollar they spend, with especially strong numbers again among Gen Z (49%) as well as lower-income households (52%).
A big indicator of significant change is impulse buys, those last-minute, pressure-fueled purchases we regret later, like candy bars at the grocery checkout. Fifty-seven percent of Americans say they are making fewer impulse purchases than three months ago—the single most common behavior shift in the entire study. Others hover around half, with 51% eating at restaurants less often, 46% ordering food delivery less, and 46% cutting back on hobby spending.
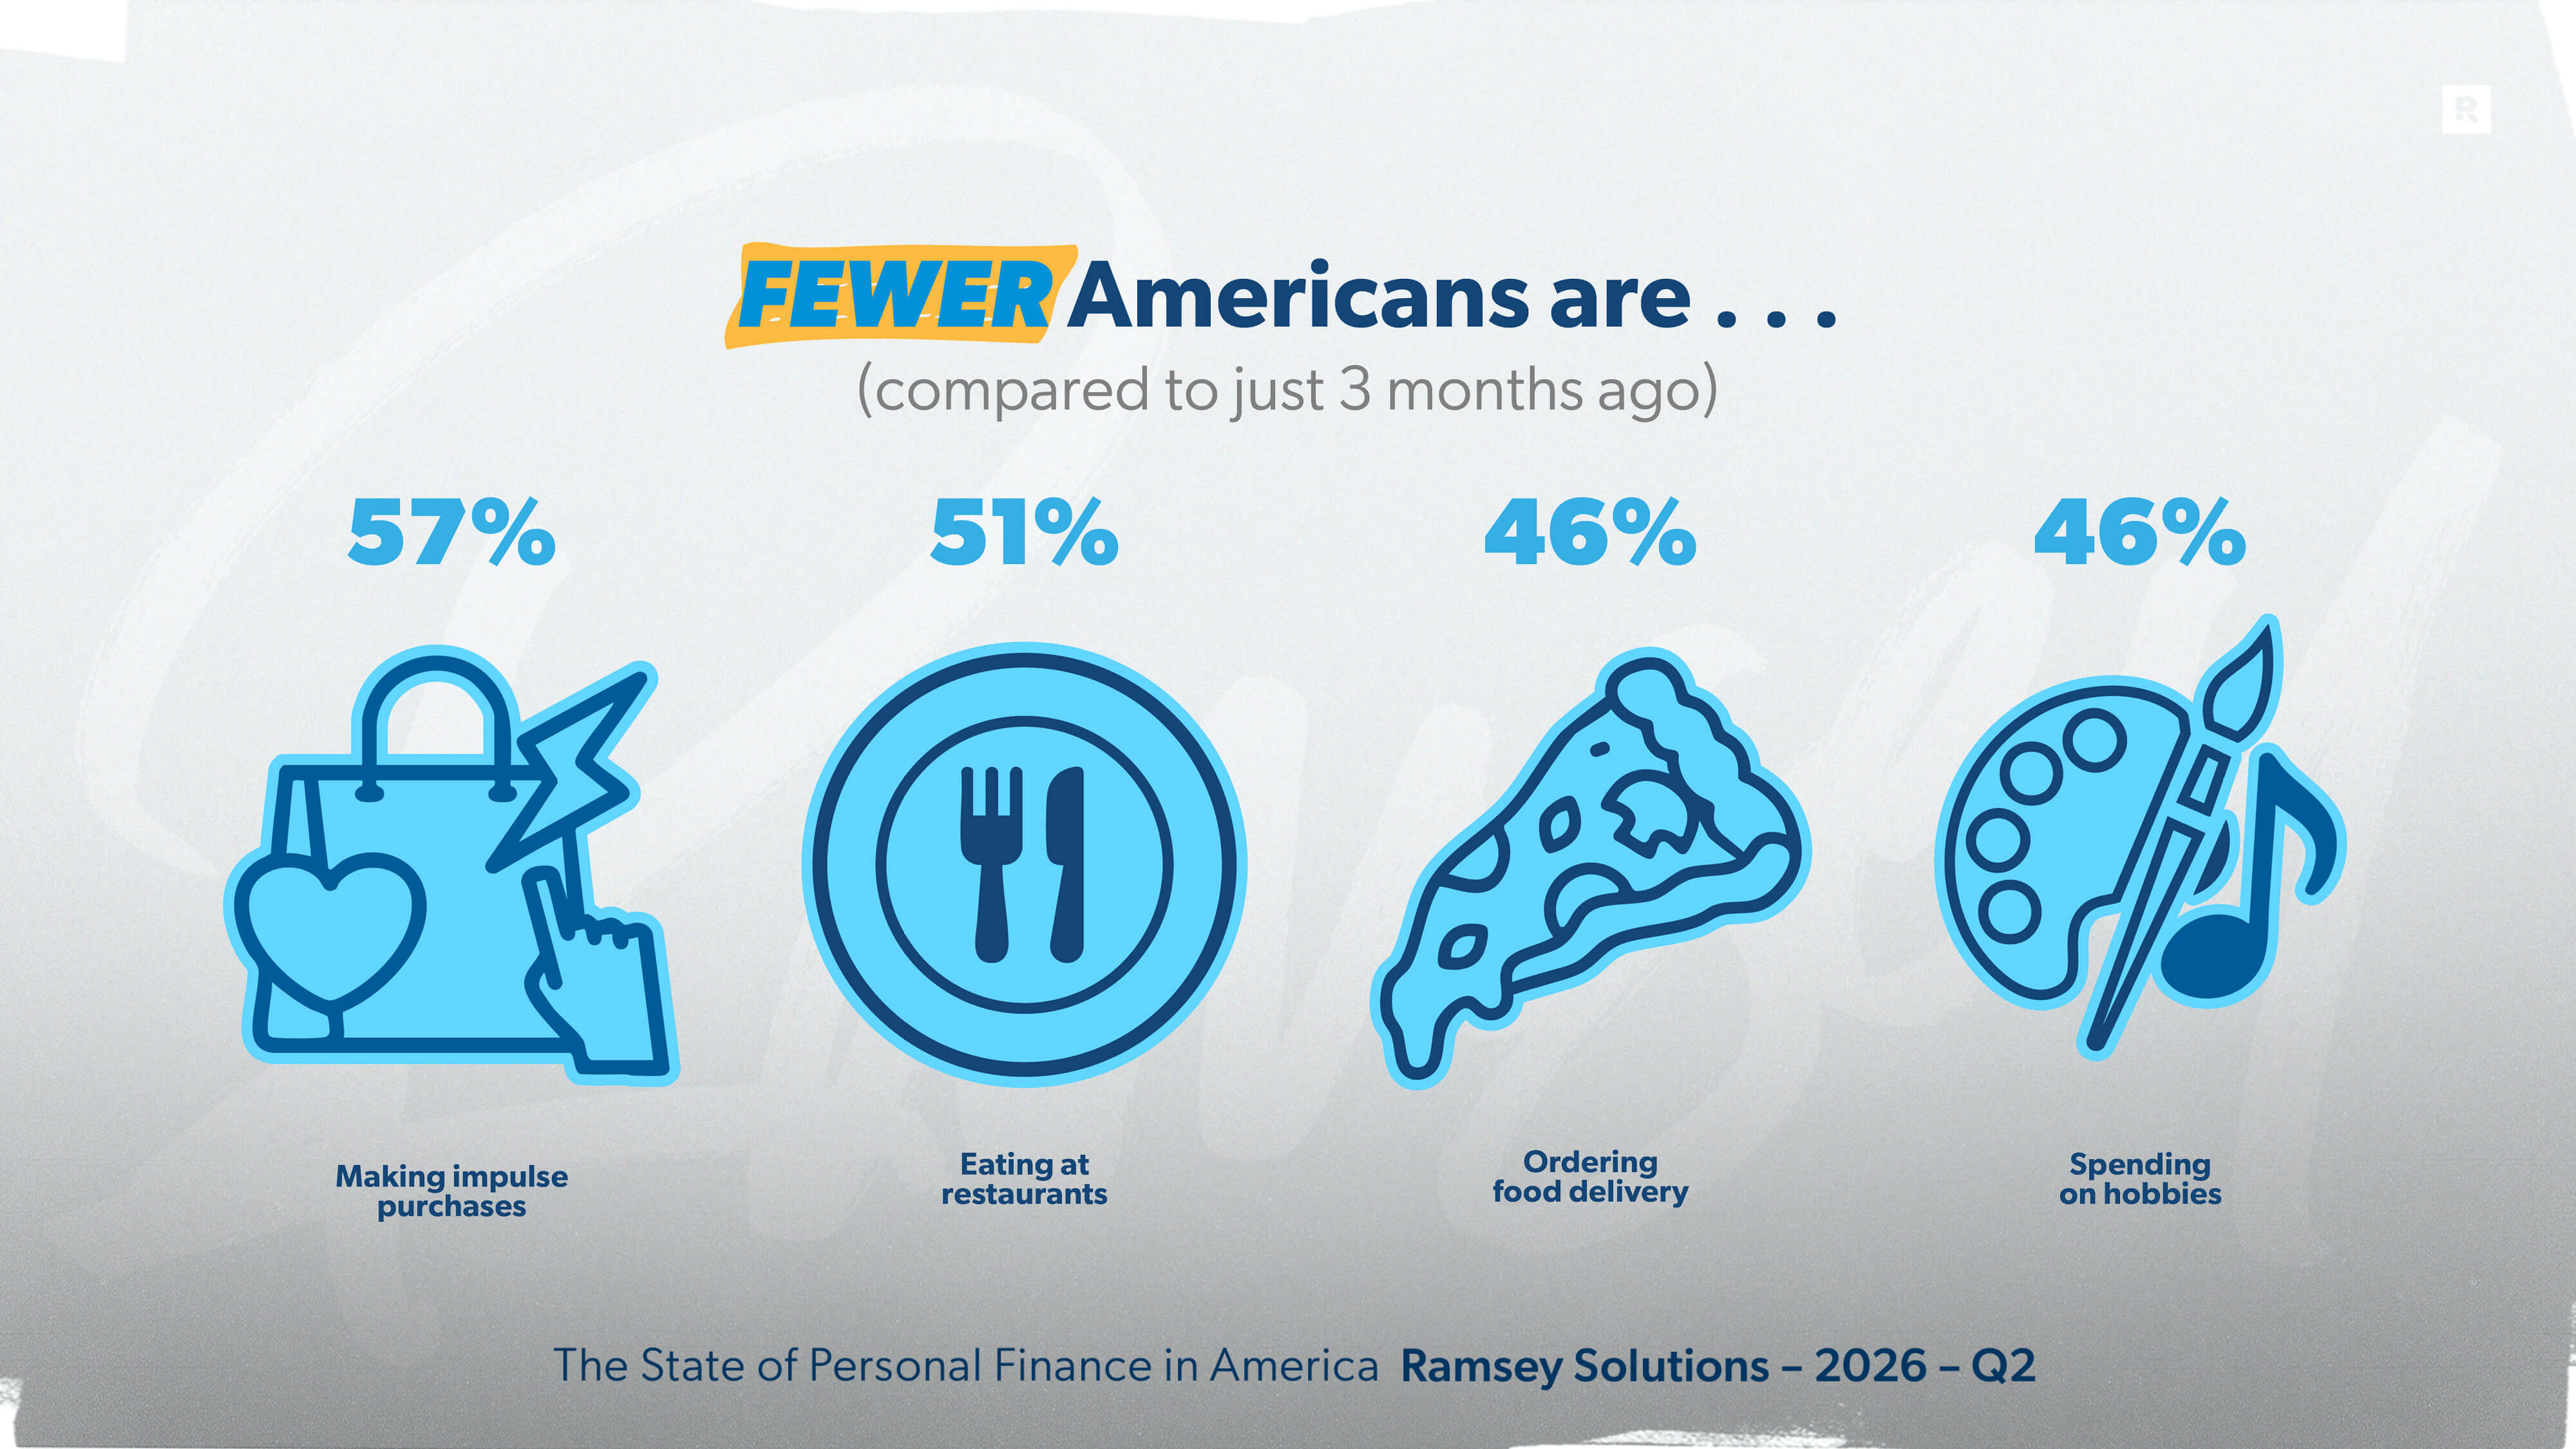
This behavior shift is happening across income levels and generations. Lower-income households are making these changes out of necessity. Higher-income households are making them by choice.
The Brown Bag Economy isn’t glamorous. It won’t trend on social media. But it represents hardworking Americans deciding to spend their money with intentionality. And that’s the kind of behavior shift that leads to life-change.
The Credit Card Safety Myth Busted
Fraud protection is one of the most persistent arguments for carrying a credit card. The conventional wisdom holds that credit card users are better protected when fraud occurs, that disputing a charge is faster, easier and less risky than it is with a debit card. It’s “the bank’s money,” after all.
But the data do not support that. Forty-one percent of American credit card users report having experienced fraudulent charges on their account. Among debit card users, 30% say the same. So credit card users actually see more fraud, a finding that makes intuitive sense since credit card numbers are more widely used across online and recurring transactions.
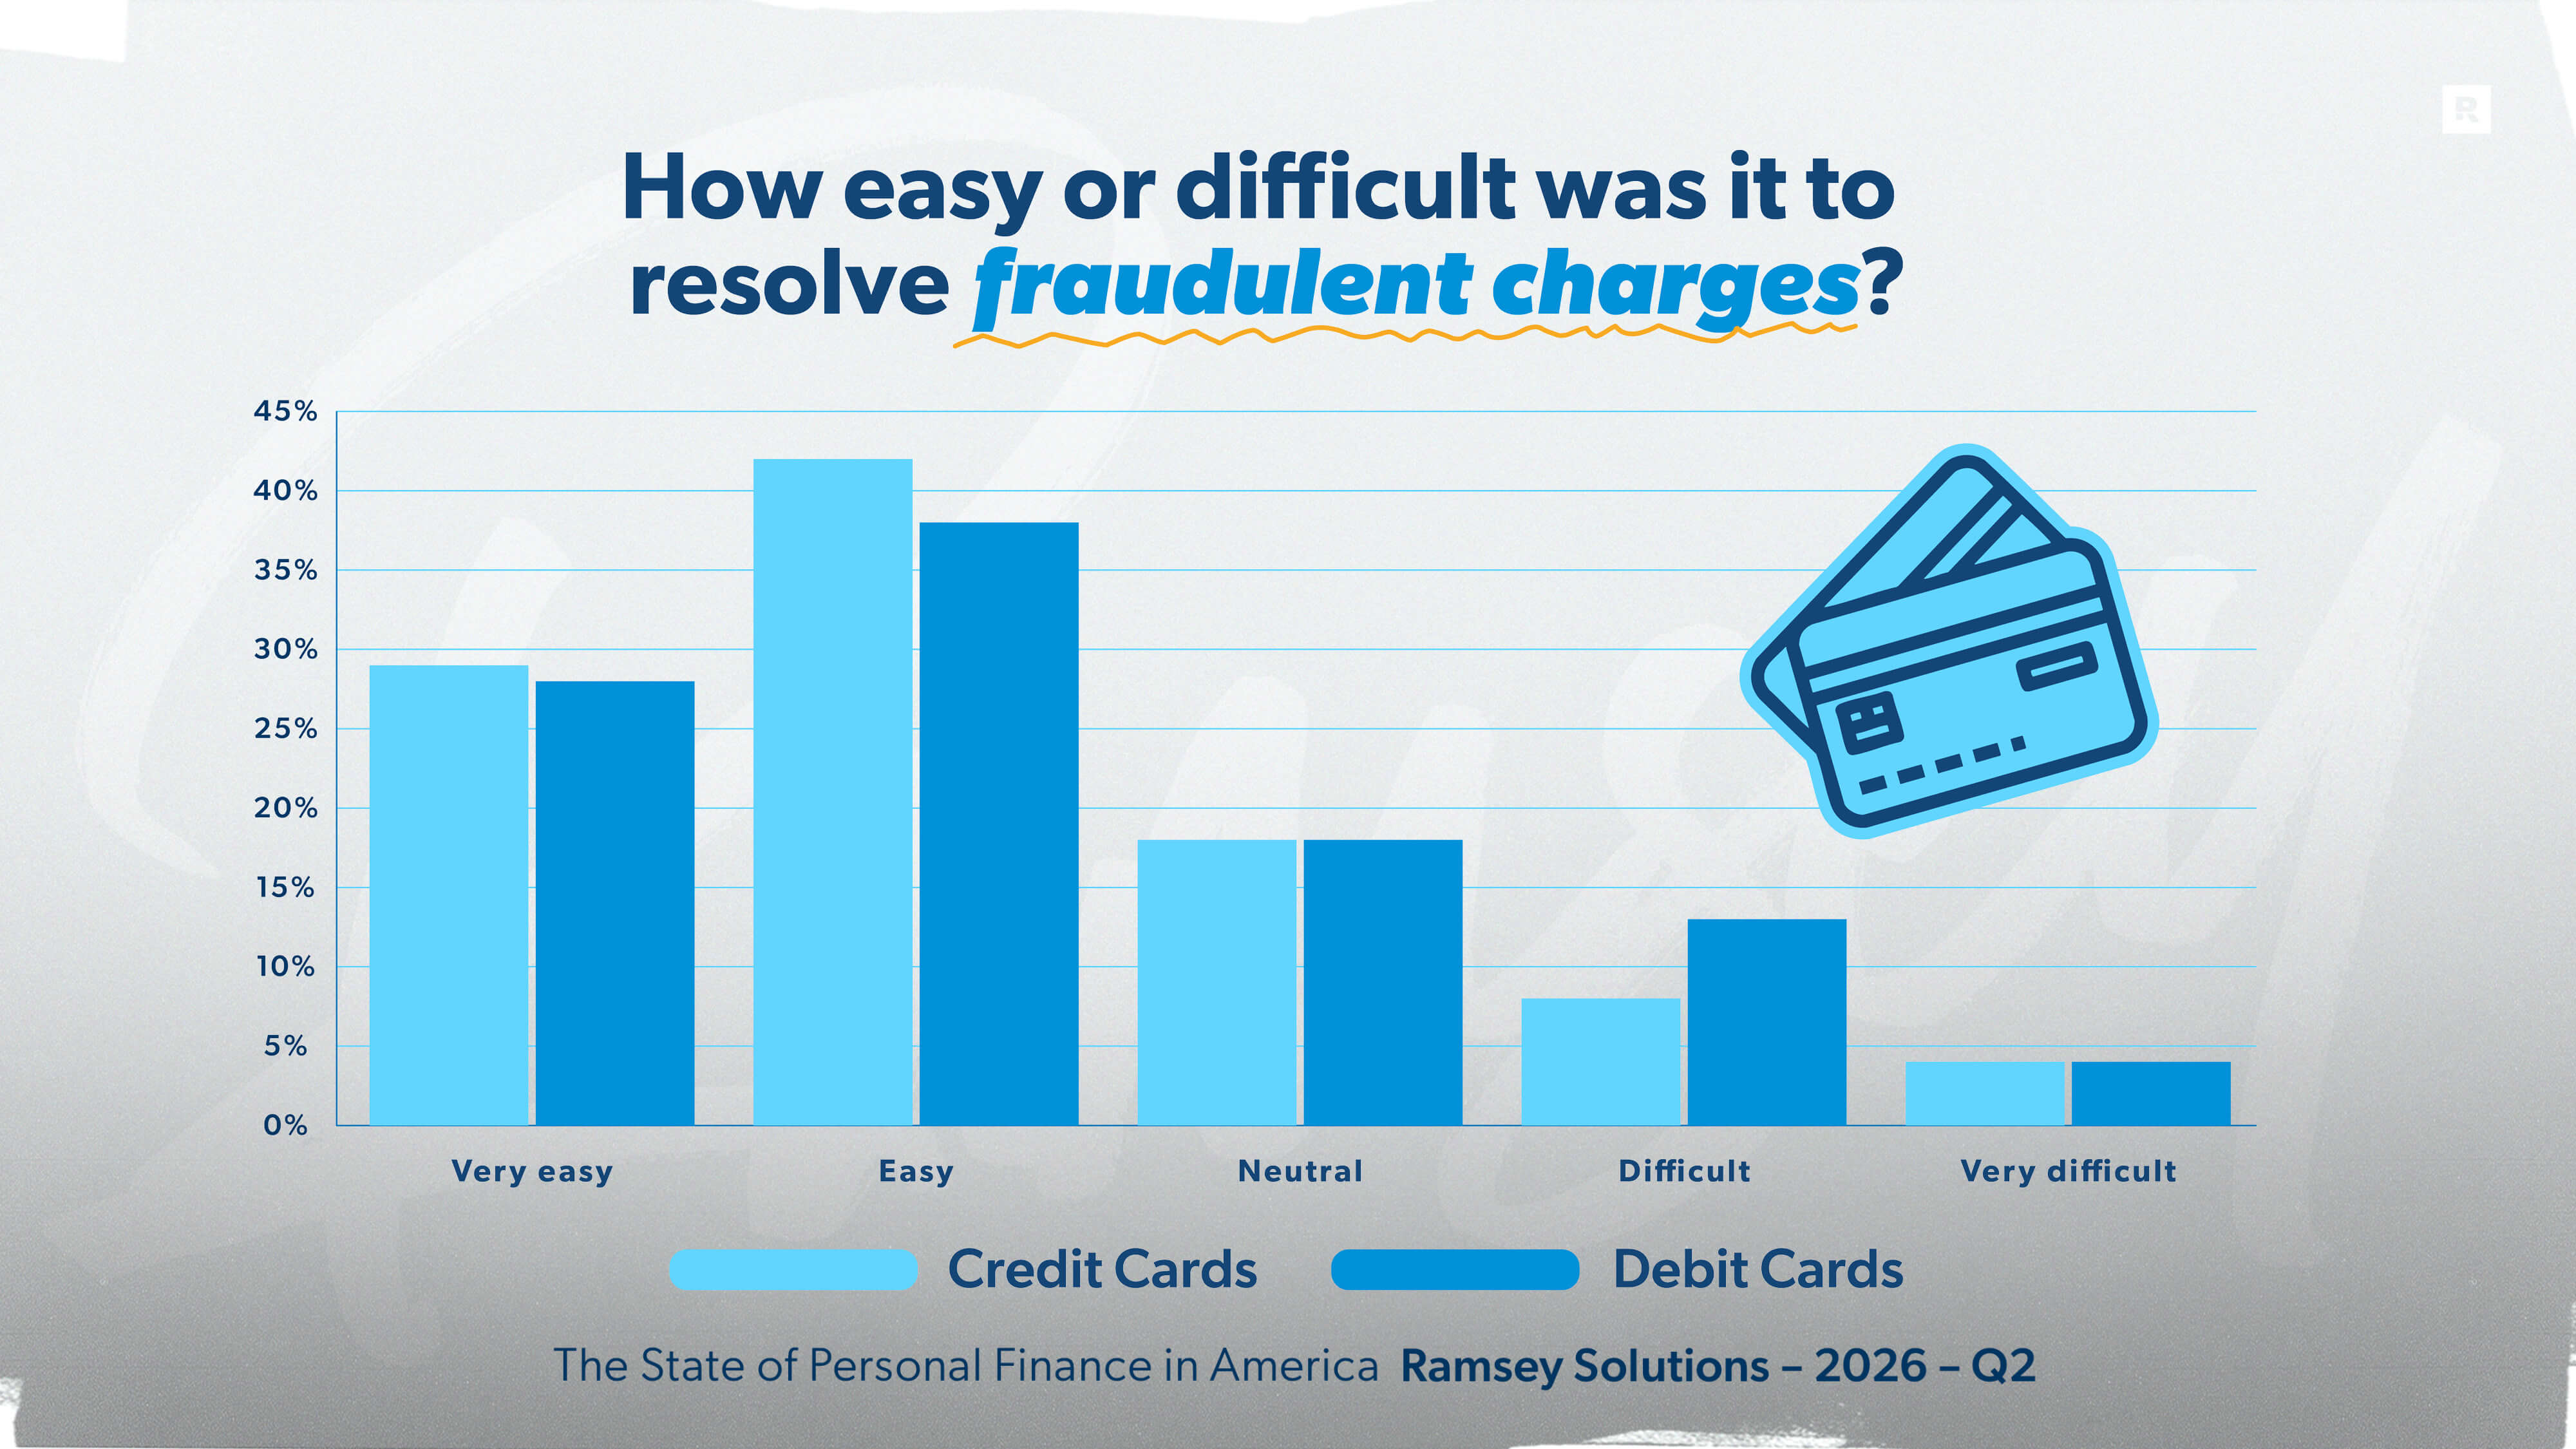
But here’s where the conventional wisdom falls apart. When asked about actually resolving that fraud, the difference between credit and debit card users is negligible. Seventy-one percent of credit card users say the resolution process was “easy” or “very easy,” and 66% of debit card users say the same. That’s not a huge difference. And this finding holds across every demographic measured in the study: Age, income and debt status produce no significant variation.
All these numbers show a very interesting fact: Debit card users aren’t fighting harder to resolve fraud. They aren’t losing more money. They aren’t navigating a more complex or adversarial resolution process. Debit cards also offer something credit cards don’t: a spending ceiling with your own money. When you pay with a debit card, you’re limited to what you actually have—and once it’s gone, it’s gone. No going into debt (that’s a good thing).
Money and Marriage: When Financial Stress Comes Home
Marriage is hard, and it’s harder when a couple isn’t on the same page with money. When couples don’t have a plan for their money, every conversation can end up being about whether they can afford something—be it the summer trip, the car repair or the unexpected bill.
Thirty-eight percent of married U.S. adults say money creates tension in their marriage. That’s an estimated 24 million couples navigating their relationship around financial stress. And as with nearly every financial finding in this study,
debt is the factor that most clearly separates households: 49% of couples with consumer debt report money tension, compared to just 21% of debt-free couples.
Gen Z married couples are definitely feeling the tension, with 66% saying money creates friction in their relationship, compared to 25% of baby boomer couples. Lower-income households are also more affected: 52% of married
Americans earning under $50,000 report money tension versus 32% of those earning over $100,000.
These numbers show that financial stress in a marriage is affected by the same factors that affect financial stress in general: debt load, income and age.
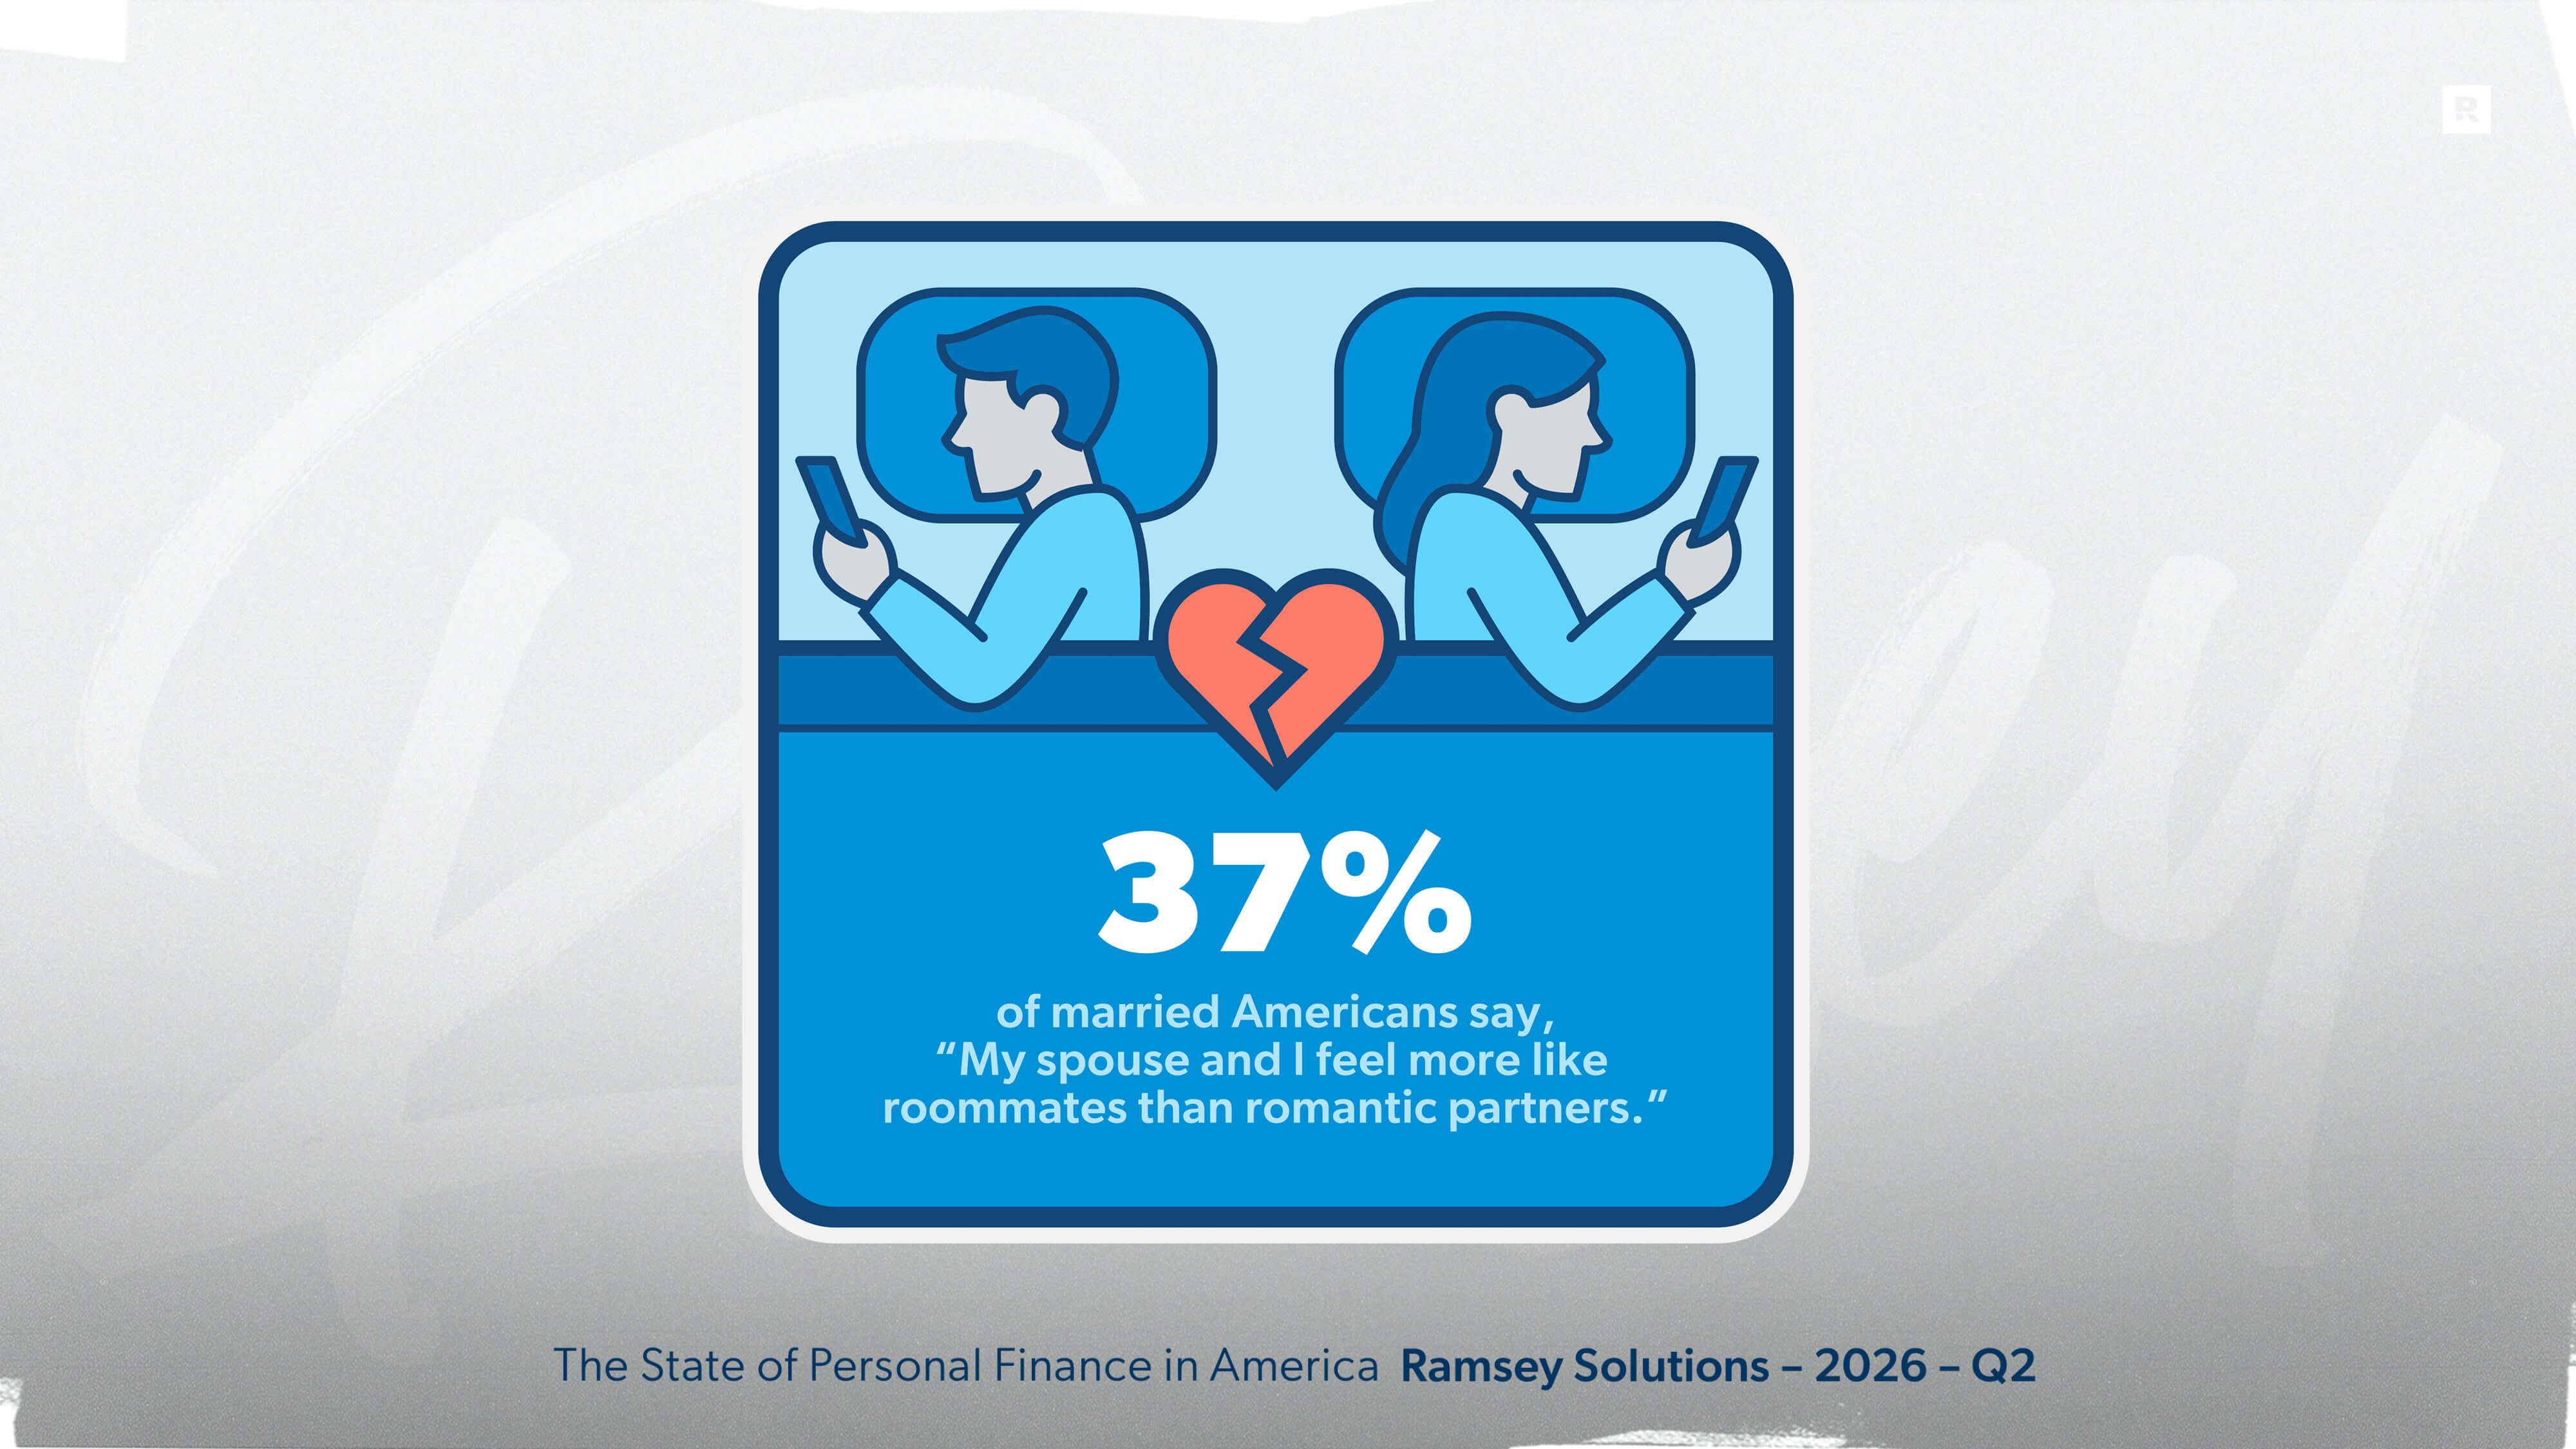
Money stress in a marriage can show up in many unhealthy ways. Just over one-third of married Americans (37%) say they “feel more like roommates than romantic partners.” Men are more likely to feel this way (42% vs. 32% of women).
Millennials report it most (44%). And those carrying consumer debt are more likely to describe the roommate dynamic (41%) than those who are debt-free (32%).
For a significant portion of Americans, money tension has caused lasting damage in their relationships. One in 4 Americans (25%) say a financial disagreement has hurt or ended a relationship. For Americans who are divorced, that number climbs to 44%. But for currently married Americans, it drops to 18%. This gap shows that when money conflict is left unaddressed—it has consequences that compound over time.
Among the different age brackets, 31% of Gen Z say money disagreements have hurt or ended a relationship. For millennials, it’s 29%. Gen X is at 25% and baby boomers are at 17%.
Who controls the financial decisions matters more than most couples probably realize. Nearly half of married Americans (48%) say they personally handle most of the financial decisions in their household. Only 11% say their spouse does, and 39% say decisions are shared equally.
In marriages that respondents describe as “great,” 46% make financial decisions together. In marriages that are just “okay,” only 20% do. Couples in great marriages are more than twice as likely to share the financial decision-making, showing that financial teamwork and marital satisfaction go hand in hand.
Generationally, baby boomers are the most likely to share financial decisions equally (47%). Gen Z is the least likely (31%)—continuing the pattern of the younger generations throughout this study. It seems that Gen Z couples, the generation experiencing the most financial stress, also make the fewest financial decisions together.
Despite all the tension in the numbers, there appears to be a firm financial foundation for most couples. A supermajority of married Americans (85%) say they feel financially supported by their spouse. In every income bracket, every generation and every debt category, that number stays between 82% and 89%.
Conclusion
As the country turns 250, most Americans feel financially independent. But that perception differs depending on how much debt you carry, how much money you earn, and which generation you belong to.
External and internal factors make money stress worse. And right now, we’re dealing with everything from a geopolitical conflict causing gas prices to rise to 62 million people carrying debt anxiety every single day to younger Americans feeling like they’re starting the race from behind.
And yet, Americans aren’t sitting around waiting for someone to fix it. They’re packing lunches and combining errands. They’re saying no to impulse buys and yes to store brands. They’re tracking every dollar and putting money away from each paycheck.
That’s the Brown Bag Economy at work. Little bits of discipline lead to true behavior change. That’s the mindset that will bring about true financial peace—one intentional decision at a time.
The path to true financial peace is difficult, but not impossible. The circumstances might change, but the winning formula is tried and true: Get on a budget, eliminate debt, and build savings. That’s the real way to not just feel financially independent but to actually be financially independent.
About the Study
The State of Personal Finance in America is a quarterly research study conducted by Ramsey Solutions to gain an understanding of the personal finance behaviors and attitudes of everyday Americans. The nationally representative sample of 1,004 U.S. adults was fielded June 10–16, 2026, using a third-party research panel. Margin of error was ±3.08%.
Since January of 2021, The State of Personal Finance has surveyed over 20,000 U.S. adults. Data from the study have been shared on over 1,000 media outlets, including Forbes, Fox News Channel, The New York Times and Good Morning America.
Previous Reports
Get Weekly Insights Delivered Straight to Your Inbox
Did you find this article helpful? Share it!

About the author
Ramsey Solutions

Get proven Ramsey answers fast.