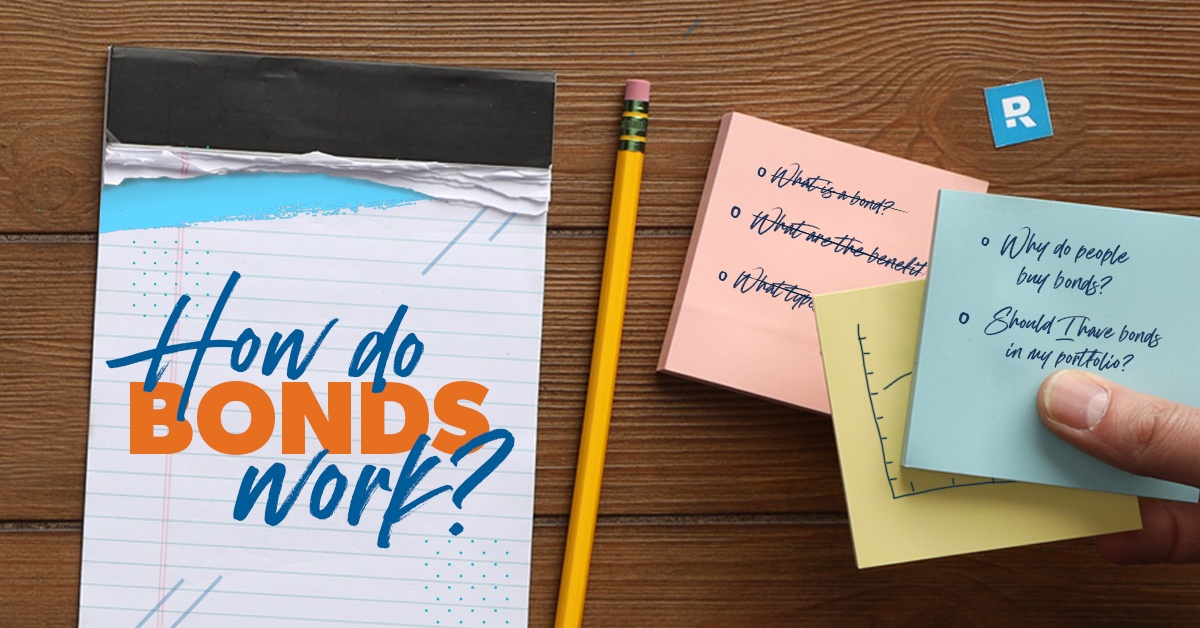
What Are Bonds and How Do They Work?
10 MIN READ | SEP 6, 2023
 By
By
No, we're not talking about everyone’s favorite martini-drinking spy. We're talking about bonds that are used as investments. Still, bonds do seem to have an element of mystery to some folks.
A bond is a type of loan between an investor and a corporate or government borrower that promises to repay the money with interest. You might also hear a bond called a fixed-income security, which is just Wall Street talk for an investment that pays fixed returns in the form of recurring interest payments.
Since they’re often backed by governments and guarantee a steady return, bonds are seen as a “safe” investment and attract a lot of investors. In fact, more than $123 trillion is invested in the global bond market!1 But what exactly is a bond? And are bonds a good place to park your hard-earned money?
Let’s see if they belong in your retirement investment strategy.
What Is a Bond?
Companies and governments at all levels (state, local, federal) issue bonds to borrow money for projects too expensive for a bank to fund. A government could need money for infrastructure projects like roads or bridges. Or a large corporation might need millions of dollars to build a new factory. So what do they do? They borrow money from investors through bonds.
By issuing bonds, they’re basically handing out IOUs where they agree to pay you interest on the loan and return your principal at a specific date in the future. That’s right, you’re loaning them your money! Unlike buying stock, where you are buying partial ownership of a company, bonds do not have ownership attached to them. You’re simply a lender. Though most bonds have a fixed interest rate, bonds with variable rates are gaining in popularity.
How Do Bonds Work?
Bonds are kind of like the certificates of deposit (CDs) of the investing world: easy to set up, relatively low-risk, but quite often, low-reward.
In return for your loan to a government or company, you get consistent interest payments from the borrower until the bond reaches its maturity date—that’s the date they’ve agreed to pay you back for the original loan amount.
If you decide to jump into the bond market, here’s what to expect.
Let’s say you buy a $1,000 bond from your local government. The term of the bond is 20 years with a fixed annual interest rate of 5%. In this scenario, you’d receive $50 in interest payments each year (nothing to write home about!) from the city throughout the bond’s term. At the end of 20 years when the bond matures, you’d get your initial $1,000 back. That means after two decades, your initial $1,000 investment turned into $2,000.
Getting a 5% return per year is not good growth when you compare it to the 10–12% return on investment you could earn in the stock market. Plus, bonds do not use the power of compound interest. A $1,000 investment with 5% compound interest would yield $2,650 at the end of 20 years.
Bond Terminology
If you invest in bonds, you’ll run across some words that can be confusing at times. Spoiler alert: A bond coupon is not something you can clip to save money on your purchase. Here are some terms to keep in mind:

Coupon: This word dates back to the olden days when companies issued paper bonds with little payment coupons attached that included a date and a monetary value. Bonds typically pay interest twice a year, so if you owned a bond, you would cut off the coupon at the appropriate date and redeem it for cash. Today, the coupon or coupon payment refers to the amount of interest and when it will be paid, but all of that is done electronically now.
Par value: This has nothing to do with sinking a 12-foot putt. Par value is the face value or the price of the bond when it was first issued. It‘s also its value at maturity.
Maturity: This is the date when you will receive the face value of a bond. Bond terms can range from one year to 10 or more years. A bond with a maturity of less than three years is called a short-term bond. Medium-term bonds are 4–10 years, and long-term bonds are more than 10 years.2
Types of Bonds
There are all types of bonds out there, but the three main types you’ll come across are corporate, municipal and U.S. Treasuries. Let’s take a look at each one.
Corporate Bonds
Corporate bonds are offered by private and public companies to fund their growth by financing ongoing operations, new projects or acquisitions. Say a large athletic-wear company wants to acquire an overseas manufacturer, but it will cost $500 million. To fund their acquisition, the company issues bonds, borrowing the money from bondholders with the intent to pay them back the full amount plus interest.
Municipal Bonds
Like private and public companies, state or local governments issue municipal bonds (or muni bonds for short) to fund public projects like building bridges, roads, arenas or new schools. Municipal bonds often include some tax benefits. Depending on where the bonds are issued, you may not have to pay state or local taxes on them. You might also be able to avoid paying federal taxes on the interest you earn.
U.S. Treasury Bonds
Again, each bond is like an IOU, only in this case you’re the lender, not the borrower. U.S. Treasury bonds give the federal government cash to pay for government spending not covered by taxation. Backed by the “full faith and credit” of the U.S. government, these are often promoted as one of the safest investments you can make. Because, as we all know, the government is known for handling money well. (No comment.)
How to Buy Bonds
You can invest in bonds by buying new issues (initial bond offerings), purchasing bonds on the secondary market (where previously issued bonds are bought and sold), or obtaining bond mutual funds or bond exchange-traded funds (ETFs). The price you’ll pay depends on what you’re willing to bid and what the issuer is asking. There are three main ways to buy and sell bonds:
1. Use a broker. The first way to jump into the bond market is to use a broker. They’ll help you buy and sell bonds with other investors in the market.
2. Buy and sell directly with the U.S. government. You can purchase U.S. Treasury bonds directly from the government at www.treasurydirect.gov. This lets you avoid paying a fee to a broker or other middleman.3
3. Look for bond mutual funds and bond exchange-traded funds (ETFs). You can easily review the details of a mutual fund or an ETF’s investment strategy and find ones that fit your investment goals.
You can sell your bonds before the maturity date, but this comes with risks that we’ll cover in the next section. Understanding how to buy and sell bonds can be tricky for new investors. So, don’t try this at home.
Bond Ratings and Risks
So, how are you supposed to know which bonds are good to invest in and which aren’t? Well, bonds are given ratings, or scores, based on how risky they are. Basically, this rating is tied to the issuer’s ability to pay you back.
Bonds issued by established companies that are likely to make their payments are given higher ratings. And the higher-rated bonds tend to be issued at lower interest rates. Lower-rated bonds need to provide incentive to the buyer, so their interest rates are higher. Anyone investing in bonds should make sure they know the rating of the issuer. And never invest in low-rated bonds (aka junk bonds)—unless you can afford to set fire to your money!
While we’re on the topic of risks, here are a few of the most common ones to look out for in the bond market.
Credit Risk
This means the issuer may default on its bonds. When that happens, you don’t get your money back, and you can forget about the interest.
Interest Rate Risk
If you’re planning to sell your bond before the maturity date, there’s the possibility that a change in overall interest rates could reduce the value of the bond. As interest rates rise, bond prices fall, and vice versa.
Let’s look at an example. Say you own a 10-year bond with a $1,000 face value that pays 4% interest. If overall interest rates rise to 5%, then fewer investors will want to buy a bond that only pays 4%. So you might have to sell it at a discount from what you paid, which means you’d lose some of your initial investment.
Inflation Risk
If interest rates are low and inflation increases, inflation could outpace the return and sink your purchasing power.
Liquidity Risk
This is the risk that you can’t sell bonds when you want, meaning you can’t get your money out when you want either.
Call Risk
Call risk is the possibility that a bond issuer “calls,” or retires, a bond before its maturity date. This is something an issuer might do if interest rates decline (kind of like if you wanted to refinance your mortgage to snag a lower rate). This forces the investor to reinvest the money at a lower interest rate.Not all bonds are callable, and some bonds are only callable after a certain number of years.
Duration Risk
The longer a bond’s time to maturity, or duration, the higher exposure it has to changes in interest rates. This is just a measure of how a bond’s price might change as market interest rates go up and down. If you buy a bond with a 10-year maturity, you’ll ride the ups and downs for a longer period than if you bought a bond with a one-year maturity. Basically, when interest rates go up, the value of your bond falls.4
So, Are Bonds a Good Investment?
We don’t recommend betting your retirement on bonds. You’re better off investing your money in a mix of growth stock mutual funds.
What a lot of people find attractive about investing in bonds is the prospect of steady payments over the life of the bond. Having that stable income makes it easy to plan out your spending, which is why bonds are tempting additions to many retirement portfolios.
Others like to point out that bonds could take some of the sting out of Tax Day—especially municipal bonds, which are usually tax-free at the federal, state and local levels. While subject to federal taxes, Treasury bonds are also free from state and local taxes.
Bonds have a reputation for being “lower-risk” investments because they don’t fluctuate as wildly as stocks. But here’s the thing: The returns you get from bonds just aren’t impressive, especially when compared to mutual funds, because they barely outpace inflation. Remember, you want to beat the market so you can build wealth.
Get With a SmartVestor Pro
Complicated topics like bonds should motivate you to get an investment professional in your corner—someone who can help you separate fact from fiction. A SmartVestor Pro can sit down with you and help you set goals for your financial future. They can guide you no matter where you are in your investment journey!
Find a SmartVestor Pro in your area today!
Make an Investment Plan With a Pro
SmartVestor shows you up to five investing professionals in your area for free. No commitments, no hidden fees.
This article provides general guidelines about investing topics. Your situation may be unique. To discuss a plan for your situation, connect with a SmartVestor Pro. Ramsey Solutions is a paid, non-client promoter of participating Pros.
Get Weekly Insights Delivered Straight to Your Inbox
Did you find this article helpful? Share it!

About the author
Ramsey Solutions

Get proven Ramsey answers fast.